Exam 2: Organizing and Visualizing Variables
Exam 1: Defining and Collecting Data205 Questions
Exam 2: Organizing and Visualizing Variables212 Questions
Exam 3: Numerical Descriptive Measures163 Questions
Exam 4: Basic Probability171 Questions
Exam 5: Discrete Probability Distributions117 Questions
Exam 6: The Normal Distribution144 Questions
Exam 7: Sampling Distributions127 Questions
Exam 8: Confidence Interval Estimation187 Questions
Exam 9: Fundamentals of Hypothesis Testing: One-Sample Tests177 Questions
Exam 10: Two-Sample Tests300 Questions
Exam 11: Chi-Square Tests128 Questions
Exam 12: Simple Linear Regression204 Questions
Exam 13: Multiple Regression307 Questions
Exam 14: Business Analytics254 Questions
Select questions type
SCENARIO 2-14
The table below contains the number of people who own a portable Blu-ray player in a sample of 600 broken down by gender. Own a Portable Blu-ray player Male Female Yes 96 40 No 224 240
-Referring to Scenario 2-14, if the sample is a good representation of the population, we can expect percent of the population will be males.
(Essay)
4.8/5  (32)
(32)
SCENARIO 2-14
The table below contains the number of people who own a portable Blu-ray player in a sample of 600 broken down by gender. Own a Portable Blu-ray player Male Female Yes 96 40 No 224 240
-Referring to Scenario 2-14, percent of the 600 were females who either owned or did not own a portable Blu-ray player.
(Essay)
4.8/5 (32)
The main principle behind the Pareto chart is the ability to separate the "vital few" from the "trivial many."
(True/False)
4.8/5 (41)
SCENARIO 2-1
An insurance company evaluates many numerical variables about a person before deciding on an appropriate rate for automobile insurance.A representative from a local insurance agency selected a random sample of insured drivers and recorded, X, the number of claims each made in the last 3 years, with the following results. X f 1 14 2 18 3 12 4 5 5 1
-Referring to Scenario 2-1, how many drivers are represented in the sample?
(Multiple Choice)
4.8/5 (36)
SCENARIO 2-6
A sample of 200 students at a Big-Ten university was taken after the midterm to ask them whether they went bar hopping the weekend before the midterm or spent the weekend studying, and whether they did well or poorly on the midterm.The following table contains the result. Did Well in Midterm Did Poorly in Midterm Studying for Exam 80 20 Went Bar Hopping 30 70
-Referring to Scenario 2-6, if the sample is a good representation of the population, we can expectpercent of the students in the population to spend the weekend studying and do poorly on the midterm.
(Multiple Choice)
4.9/5 (32)
SCENARIO 2-11
The ordered array below resulted from selecting a sample of 25 batches of 500 computer chips and determining how many in each batch were defective. Defects 1 2 4 4 5 5 6 7 9 9 12 12 15 17 20 21 23 23 25 26 27 27 28 29 29
-Referring to Scenario 2-11, construct a relative frequency or percentage distribution for the defects data, using "0 but less than 5" as the first class.
(Essay)
4.7/5 (35)
You have collected data on the number of complaints for 6 different brands of automobiles sold in the US over a 10-year period.Which of the following is the best for presenting the data?
(Multiple Choice)
4.7/5 (32)
SCENARIO 2-11
The ordered array below resulted from selecting a sample of 25 batches of 500 computer chips and determining how many in each batch were defective. Defects 1 2 4 4 5 5 6 7 9 9 12 12 15 17 20 21 23 23 25 26 27 27 28 29 29
-Referring to Scenario 2-11, construct a cumulative percentage polygon for the defects data if the corresponding frequency distribution uses "0 but less than 5" as the first class.
(Essay)
5.0/5 (36)
2-2 Organizing and Visualizing Variables
At a meeting of information systems officers for regional offices of a national company, a survey was taken to determine the number of employees the officers supervise in the operation of their departments, where X is the number of employees overseen by each information systems officer. X f 1 7 2 5 3 11 4 8 5 9
-Referring to Scenario 2-2, across all the regional offices, how many total employees were supervised by those surveyed?
(Multiple Choice)
4.9/5 (38)
SCENARIO 2-18
The stem-and-leaf display below shows the result of a survey on 50 students on their satisfaction with their school with the higher scores represent higher level of satisfaction. 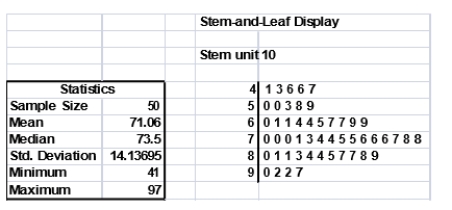 -Referring to Scenario 2-18, the level of satisfaction is concentrated around 75.
(True/False)
4.9/5 (40)
SCENARIO 2-6
A sample of 200 students at a Big-Ten university was taken after the midterm to ask them whether they went bar hopping the weekend before the midterm or spent the weekend studying, and whether they did well or poorly on the midterm.The following table contains the result. Did Well in Midterm Did Poorly in Midterm Studying for Exam 80 20 Went Bar Hopping 30 70
-Referring to Scenario 2-6, if the sample is a good representation of the population, we can expectpercent of those who did poorly on the midterm to have spent the weekend studying.
(Multiple Choice)
4.8/5 (38)
The Best Practices for Creating Visual Summaries recommend using varying scale to conserve precious space whenever possible.
(True/False)
4.8/5 (39)
SCENARIO 2-5
The following are the duration in minutes of a sample of long-distance phone calls made within the continental United States reported by one long-distance carrier. Time(inMinutes) Relative Frequency 0 but less than 5 0.37 5 but less than 10 0.22 10 but less than 15 0.15 15 but less than 20 0.10 20 but less than 25 0.07 25 but less than 30 0.07 30 or more 0.02
-Referring to Scenario 2-5, if 100 calls were randomly sampled, how many calls lasted 15 minutes or longer?
(Multiple Choice)
4.9/5 (37)
SCENARIO 2-5
The following are the duration in minutes of a sample of long-distance phone calls made within the continental United States reported by one long-distance carrier. Time(inMinutes) Relative Frequency 0 but less than 5 0.37 5 but less than 10 0.22 10 but less than 15 0.15 15 but less than 20 0.10 20 but less than 25 0.07 25 but less than 30 0.07 30 or more 0.02
-Referring to Scenario 2-5, if 100 calls were sampled, of them would have lasted 20 minutes or more.
(Multiple Choice)
4.9/5 (19)
The Best Practices for Creating Visual Summaries recommend using the simplest possible visualization.
(True/False)
4.9/5 (35)
The percentage distribution cannot be constructed from the frequency distribution directly.
(True/False)
4.7/5 (42)
SCENARIO 2-5
The following are the duration in minutes of a sample of long-distance phone calls made within the continental United States reported by one long-distance carrier. Time(inMinutes) Relative Frequency 0 but less than 5 0.37 5 but less than 10 0.22 10 but less than 15 0.15 15 but less than 20 0.10 20 but less than 25 0.07 25 but less than 30 0.07 30 or more 0.02
-Referring to Scenario 2-5, if 100 calls were sampled, of them would have lasted less than 5 minutes or at least 30 minutes or more.
(Multiple Choice)
4.8/5 (33)
The point halfway between the boundaries of each class interval in a grouped frequency distribution is called the _.
(Essay)
4.9/5 (38)
SCENARIO 2-18
The stem-and-leaf display below shows the result of a survey on 50 students on their satisfaction with their school with the higher scores represent higher level of satisfaction.
-Referring to Scenario 2-18, how many students have a satisfaction level below 60?
(Essay)
4.7/5 (37)
Filters
- Essay(0)
- Multiple Choice(0)
- Short Answer(0)
- True False(0)
- Matching(0)