Exam 13: Asking and Answering Questions About the Difference Between Two Means
Exam 1: Collecting Data in Reasonable Ways56 Questions
Exam 2: Graphical Methods for Describing Data Distributions62 Questions
Exam 3: Numerical Methods for Describing Data Distributions37 Questions
Exam 4: Describing Bivariate Numerical Data70 Questions
Exam 5: Probability55 Questions
Exam 6: Random Variables and Probability Distributions72 Questions
Exam 7: An Overview of Statistical Inference - Learning From Data19 Questions
Exam 8: Sampling Variability and Sampling Distributions35 Questions
Exam 9: Estimating a Population Proportion36 Questions
Exam 10: Asking and Answering Questions About a Population Proportion31 Questions
Exam 11: Asking and Answering Questions About the Difference Between Two Proportions42 Questions
Exam 12: Asking and Answering Questions About a Population Mean51 Questions
Exam 13: Asking and Answering Questions About the Difference Between Two Means46 Questions
Exam 14: Learning From Categorical Data36 Questions
Exam 15: Understanding Relationships - Numerical Data Part 243 Questions
Exam 16: Asking and Answering Questions About More Than Two Means25 Questions
Select questions type
A common memory task is the classification of objects into categories. For example, a table is a piece of furniture; a dog is an animal, etc. This classification capability was used in a recent study of divided attention. College Psychology students were randomly selected and randomly assigned to one of two experimental conditions: divided attention and no divided attention. Students in the "divided attention" group were asked to memorize a list of 36 words while simultaneously listening to a tape recorder; students in a control group were told to memorize a list of 36 words and did not listen to a tape recorder. Each student was then asked to classify the 36 words into 6 categories. (There were 6 words in each category.) The distributions of the correct number of recalled words / category were approximately normal in each of the groups, and a summary of the data for the words/category recalled are presented below: 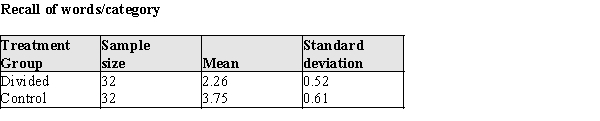
a)Is there evidence that the memory performance differs in the two groups? Test the appropriate hypothesis using α = 0.05.
b)One possible implication of this study is that high school students should not be dividing their attention by listening to music while studying. What results, if any, of this study would support the contention that students should not be dividing their attention?
(Essay)
4.9/5  (32)
(32)
A researcher investigates the effect of a new drug on resting heart rate.The resting heart rates of 15 patients are measured before and after administration of the drug. The results are summarized in the table below. 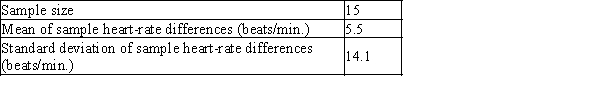 The question of interest is whether the resting heart rate increases after administration of the drug. Find the 95% confidence interval for the mean between population differences for heart rates.
(Multiple Choice)
4.9/5 (27)
Samples from two independent, normally-distributed populations produced the following results. 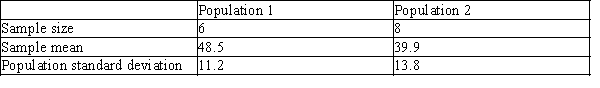 Calculate the test statistic for the difference between population means,
  .
.
(Multiple Choice)
4.9/5 (31)
The number of degrees of freedom of the two-sample t test are the same as the degrees of freedom for the paired t test statistic.
(True/False)
4.8/5 (31)
Body fat and lean body mass can be estimated in living animals by measuring the total body electrical conductivity (TOBEC). This technique is useful when attempting to determine if "diet drugs" are working on laboratory rats over time--the researchers need not sacrifice the animals to measure the amount of adipose body fat after periods of drug usage. However, the procedure requires that the animal be totally inside the measurement chamber, which is fairly small. Some rats are so big their tails must be tucked under their bodies before putting them into the measurement chamber. This is causing concern among the researchers, because there is a possibility the tail position might alter the measurements. To see if the TOBEC measurement is altered by the tail position of the rats, an experiment was run on 16 rats ranging in weight from 210 to 505g.
The rats were randomly assigned the order of measurement, with 8 rats measured in the tail-under position first, and 8 rats in the tail-extended position.The data for the lean mass measures, and the differences, are presented in the table below. 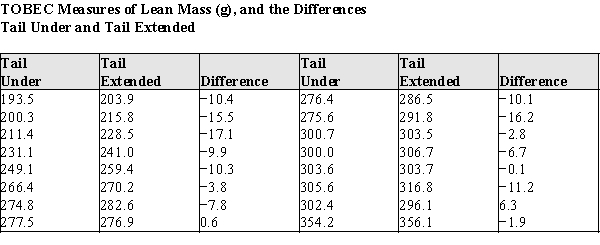 a)Using graphical display(s) of your choice show that the assumptions necessary for the paired t-test are plausible.
b)Test the hypothesis that there is no difference between the population mean TOBEC measurements of rats in the tail-under vs.the tail-extended positions.For purposes of the statistics you may assume that these rats are a random sample of laboratory rats.
c)Write a short paragraph based on your analysis above, explaining your results for laboratory technicians.Your paragraph should advise them whether or not it is necessary to make sure the tail positions of the rats are the same when replicating the lean mass body measurements during the experiment.
a)Using graphical display(s) of your choice show that the assumptions necessary for the paired t-test are plausible.
b)Test the hypothesis that there is no difference between the population mean TOBEC measurements of rats in the tail-under vs.the tail-extended positions.For purposes of the statistics you may assume that these rats are a random sample of laboratory rats.
c)Write a short paragraph based on your analysis above, explaining your results for laboratory technicians.Your paragraph should advise them whether or not it is necessary to make sure the tail positions of the rats are the same when replicating the lean mass body measurements during the experiment.
(Essay)
4.9/5 (35)
Researchers want to check whether women really speak more than men per day. During the day conversations of 873 adults selected randomly were recorded and then analyzed for the number of words. Researchers report that the mean number of words per day for the sample of women was 15,734 and the mean number for the sample of men was 13,813. The resulting data are given in the accompanying table.
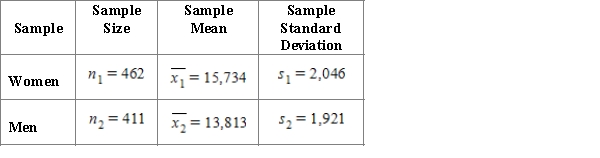
Construct and interpret a 95% confidence interval estimate for the difference in mean number of words per day for women and men.
Construct and interpret a 95% confidence interval estimate for the difference in mean number of words per day for women and men.
(Multiple Choice)
4.9/5 (42)
The perception of danger is an important characteristic for survival of animals. In a field experiment in Costa Rica, investigators located and directly approached black iguanas; that is, they walked straight towards them. Two treatments were randomly assigned to the individual iguanas. In one treatment the investigator gazed at the iguana while approaching, "maintaining eye contact." In a second treatment, the investigator did not gaze at the iguana while approaching. The outcome measure was the distance of the investigator from the iguana when it decided to run away. The researchers believe that eye contact is noticed by the iguana, leading to a longer approach distance. Data from this experiment appears in the table below. 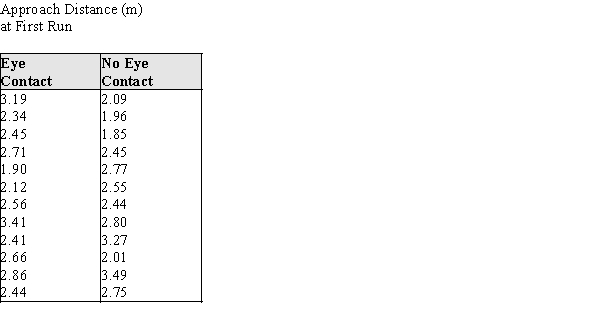
a)Using a graphical display of your choosing, assess the assumption that the distributions of approach distances are approximately normal. State your conclusion in a few sentences.
b)Assuming that it is OK to proceed with a two-sample t procedure, determine if there is sufficient evidence to conclude that there is a shorter mean approach distance for the "Eye contact" group.
c)In a few sentences, state any concerns you have about your conclusions in part (b), based on your results from part (a). If you have no concerns, write "No concerns."
(Essay)
4.9/5 (30)
When estimating the difference between two treatment effects, the format of the confidence interval is different from that used to estimate the difference between two population means.
(True/False)
4.9/5 (27)
Samples from two independent, normally-distributed populations produced the following results. 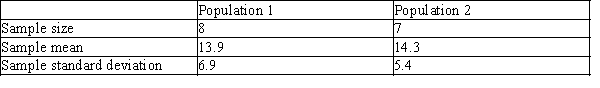 Calculate the test statistic for the difference between population means, µ1-µ2
(Multiple Choice)
4.9/5 (36)
When testing hypotheses involving treatment effects in an experiment, the conclusions of any inference test should be worded in terms of what quantities?
(Essay)
4.8/5 (40)
The number of degrees of freedom used in the two-sample t test for independent samples are the same as the degrees of freedom used in the construction of a confidence interval for μ1 − μ2.
(True/False)
4.9/5 (41)
Karl is a software developer who is interested in determining whether two random number generators have the same population mean.Random number generator A has a population standard deviation of 1.00 and random number generator B has a population standard deviation of 1.25.
Karl took a sample of 10 trials from each generator.The results are summarized below. 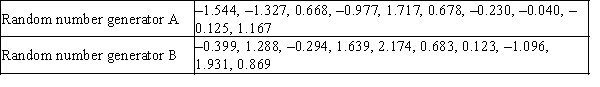 Find the P-value for the test of the difference between the population means for these two generators.
(Multiple Choice)
4.9/5 (34)
The Iowa Tests of Basic Skills is a collection of various achievement tests given to students in grades 1 - 8. Student achievement levels are reported on a scale that runs from 0 to 13. The North Snowshoe Community Schools are evaluating their reading program for students whose native language is not English. In one part of the study the reading comprehension of 10 students, randomly selected from a large population of students in the program, take the Reading Comprehension test in third and fourth grade. Their scores for each year, in grade equivalents, are listed below. 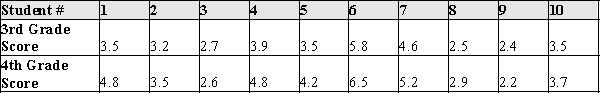 "Normal" growth, by definition, is a change of 1.0. Using the data above, test the hypothesis that the difference in means for 3rd and 4th grade students in this program for non-native English speakers is equal to 1.0.
(Essay)
4.9/5 (40)
The data below give the weights in ounces of randomly-selected bars of bath soap produced by two different molding machines. 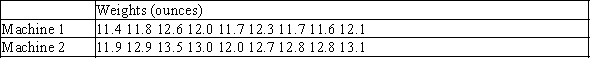 The question of interest is whether these two molding machines produce soap bars of differing average weight. Find a 95% confidence interval for the population difference assuming that the weights for the two machines are approximately normal.
(Multiple Choice)
4.9/5 (28)
A study is conducted to determine the effect of different doses of a cold medication on reaction times. In a study of 20 participants between 20 and 25 years of age, half were given a single dose of medication and the other half were given two doses. Thirty minutes after dosing, a simple mechanical experiment measured subject reaction time in milliseconds. The results are summarized below. 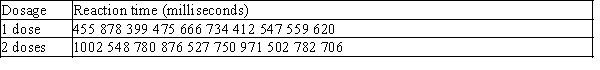 Calculate the 95% confidence interval for the difference in reaction times for these two groups. Assume that the reaction times are normally-distributed and that the treatments were randomly assigned.
(Multiple Choice)
4.7/5 (27)
As part of the foraging behavior assessment described in the previous problem, investigators also measured the bill depths of the male and female Downy Woodpeckers. Summary statistics for these measures are given in the table below: 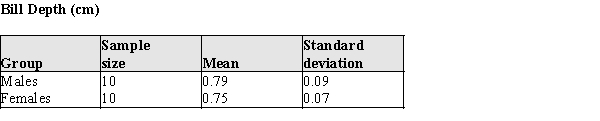 An initial analysis of the data revealed that it was reasonable to assume the bill depths for both sexes are approximately normal.
a)Construct a 95% confidence interval for the difference in bill depths of the males and females.
b)Do the data indicate that the bill depths differ? Justify your answer statistically.
An initial analysis of the data revealed that it was reasonable to assume the bill depths for both sexes are approximately normal.
a)Construct a 95% confidence interval for the difference in bill depths of the males and females.
b)Do the data indicate that the bill depths differ? Justify your answer statistically.
(Essay)
4.8/5 (28)
Suppose a researcher is testing a new diet drug. She would like to determine if the drug helps to significantly increase weight loss versus a placebo. She randomly assigns 40 participants to the treatment group and 35 to the placebo group. After 4 weeks on identical diets, the mean weights loss (in pounds) for each group is computed. Results of the study are as follows:
Treatment Group
Placebo Group
n = 40
n = 35
 = 5.6
= 5.6
 = 1.6
s = 2.85
s = 1.47
Create a 95% confidence interval for the difference of treatment effects.
= 1.6
s = 2.85
s = 1.47
Create a 95% confidence interval for the difference of treatment effects.
(Essay)
4.9/5 (34)
Does the gas leakage rate from automobile tires depend on the type of gas used to fill them? A sample of automobile tires are filled with nitrogen to a pressure of 1 atmosphere, and the time is measured for the internal pressure to fall to 0.9 atmospheres. The experiment is repeated for this sample of tires, but using sulfur hexafluoride in place of nitrogen. The results are summarized below. 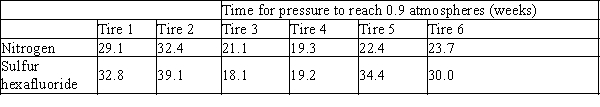 The null hypothesis is that the difference in mean population leak times is zero. Calculate a 95% confidence interval for the mean of population differences in leak times. Assume the leak times are normally distributed.
(Multiple Choice)
4.8/5 (32)
In 1992 Hurricane Andrew struck Florida causing widespread devastation. The eye of Hurricane Andrew passed directly over a site where scientists were studying the ecology of white-tailed deer. The deer had been radio-collared prior to Andrew's appearance, and the hurricane provided an opportunity to study the effects of an awesome storm on the deer. The investigators felt that the home ranges of the deer would change, but were unsure of the direction of the change. (The home range is the average area an animal occupies while foraging for food and defending its territory.) Home ranges of animals usually do not change much unless an area is under ecological stress.
The home range data for a random sample of 18 white-tailed radio-collared deer are shown below in Table 1. The raw area of the home range for each of the deer is reported in hectares for the pre-hurricane year of 1992 and the post hurricane year of 1993. (A hectare is a metric unit of area equal to 2.471 acres.) 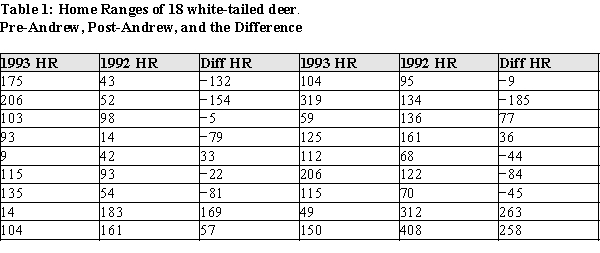
a)Using graphical display(s) of your choice show that the assumptions necessary for determining any change in the mean home ranges are plausible.
b)Construct a 95% confidence interval for the difference in means of the home ranges from before Andrew to after Andrew.
c)Do the data provide evidence of a change in the size of the home ranges after Hurricane Andrew? Provide statistical justification for your response.
(Essay)
4.8/5 (32)
Body fat and lean body mass can be estimated in living animals by measuring the total body electrical conductivity (TOBEC). This technique is useful when attempting to determine if "diet drugs" are working on laboratory rats over time--the researchers need not sacrifice the animals to measure the amount of adipose body fat after periods of drug usage. However, the procedure requires that the animal be totally inside the measurement chamber, which is fairly small. Some rats are so big that their tails must be tucked under their bodies before putting them into the measurement chamber. This is causing concern among the researchers, because there is a possibility the tail position might alter the measurements. To see if the TOBEC measurement is altered by the tail position of the rats, an experiment was run on 16 rats ranging in weight from 210 to 505
g.The rats were randomly assigned the order of measurement, with 8 rats measured in the tail-under position first, and 8 rats in the tail-extended position.The data for the body fat measures, and the differences, are presented in the table below. 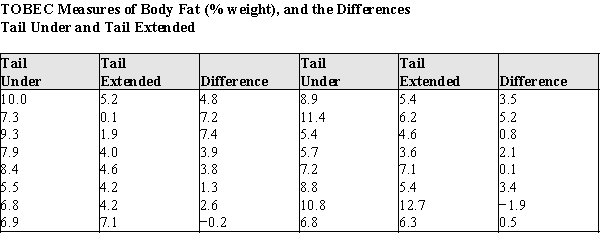 a)Using graphical display(s) of your choice show that the assumptions necessary for the paired t-test are plausible.b)Test the hypothesis that there is no difference between the population mean TOBEC body fat measurements of rats in the tail-under vs.the tail-extended positions.For purposes of the statistics you may assume that these rats are a random sample of laboratory rats.c)Write a short paragraph based on your analysis above, explaining your results for laboratory technicians.Your paragraph should advise them whether or not it is necessary to make sure the tail positions of the rats are the same when replicating the lean mass body measurements during the experiment.
(Essay)
4.7/5 (38)
Filters
- Essay(0)
- Multiple Choice(0)
- Short Answer(0)
- True False(0)
- Matching(0)