Exam 13: Nonparametric Tests
Exam 1: Introduction to Statistics60 Questions
Exam 2: Exploring Data With Tables and Graphs60 Questions
Exam 3: Describing, Exploring, and Comparing Data60 Questions
Exam 4: Probability60 Questions
Exam 5: Discrete Probability Distributions60 Questions
Exam 6: Normal Probability Distributions60 Questions
Exam 7: Estimating Parameters and Determining Sample Sizes60 Questions
Exam 8: Hypothesis Testing60 Questions
Exam 9: Inferences From Two Samples60 Questions
Exam 10: Correlation and Regression60 Questions
Exam 11: Goodness-Of-Fit and Contingency Tables60 Questions
Exam 12: Analysis of Variance59 Questions
Exam 13: Nonparametric Tests60 Questions
Exam 14: Statistical Process Control60 Questions
Select questions type
Use the runs test to determine whether the given sequence is random. Use a significance level of 0.05 . A true-false test had the following answer sequence.
T T T T F T F T F T F T T F T
T T F F F F F F F T F T F T F
Test the null hypothesis that the sequence was random.
(Essay)
4.9/5  (40)
(40)
What is the corresponding parametric test for the Kruskal-Wallis test?
(Multiple Choice)
4.9/5 (38)
Which of the following terms is sometimes used instead of "non-parametric test"?_
(Multiple Choice)
4.8/5 (41)
A standard aptitude test is given to several randomly selected programmers, and the scores are given below for the mathematics and verbal portions of the test. Use the sign test to test the claim that programmers do better on the mathematics portion of the test. Use a 0.05 level of significance. Mathematics 347 440 327 456 427 349 377 398 425 Verbal 285 378 243 371 340 271 294 322 385
(Essay)
4.8/5 (33)
Use the sign test to test the indicated claim. Fourteen people rated two brands of soda on a scale of 1 to 5. 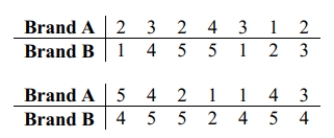 At the 5 percent level, test the null hypothesis that the two brands of soda are equally popular.
(Essay)
4.7/5 (39)
Define rank. Explain how to find the rank for data which repeats (for example, the data set: 4, 5, 5, 5, 7, 8, 12, 12, 15, 18).
(Essay)
4.7/5 (35)
Use the Wilcoxon rank-sum test to test the claim that the two independent samples come from populations with equal medians. SAT scores for students selected randomly from two different
schools are shown below. Use a significance level of 0.05 to test the claim that the scores for
the two schools are from populations with the same median. 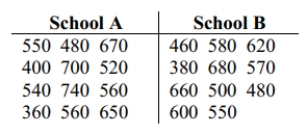
(Essay)
5.0/5 (36)
Match the parametric test with its related nonparametric test. Analysis of variance (F test)
(Multiple Choice)
4.9/5 (44)
Solve the problem. Critical values for the runs test for randomness can be calculated by listing all possible sequences. Using the elements B, B, B, R, R, R list the 20 different possible sequences. Find the number of runs for each sequence. Are you able to find 5% cutoff values for G? What do you conclude?
(Essay)
4.9/5 (41)
Use a Kruskal-Wallis test to test the claim that the samples come from populations with equal medians. SAT scores for students selected randomly from three different schools are shown below. Use a significance level of 0.05 to test the claim that the students from the three
Schools had the same median SAT score. 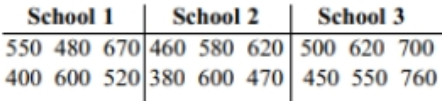 What would be the value of R1 that would be used in finding H ?
(Multiple Choice)
4.7/5 (44)
Use the sign test to test the indicated claim. The heights of 16 randomly selected women are given below. Use a significance level of 0.05 to test the claim that the population median is
equal to 64.0 inches. 62.9 61.9 66.4 68.5 63.7 64.0 65.2 67.0 70.2 65.3 64.0 60.3 64.3 66.9 65.0 63.8
(Essay)
4.9/5 (28)
Use the runs test to determine whether the given sequence is random. Use a significance level of 0.05. Test the sequence of digits below for randomness above and below the value of 4.5. 0 4 7 3 6 0 9 7 4 8 7 2 8 5 7 3 9 6 4 6 4 7 9 1 6 1 9 5 8 3 7 8 5 7 3 5 2 9 3 8
(Essay)
4.8/5 (43)
Use the runs test to determine whether the given sequence is random. Use a significance level of 0.05. The sequence of numbers below represents the maximum temperature (in degrees
Fahrenheit)in July in one U.S. town for 30 consecutive years. Test the sequence for
randomness above and below the median. 94 96 97 99 95 90 97 98 100 100
92 95 98 99 102 97 97 101 99 100
98 95 93 99 101 99 101 100 99 103
(Essay)
4.9/5 (30)
Describe the Wilcoxon rank-sum test. What type of hypotheses is it used to test? What assumptions are made for this test? What is the underlying concept?
(Essay)
4.9/5 (39)
Use the Wilcoxon signed -ranks test to test the claim that the matched pairs have differences that come from a population with a median equal to zero. Eleven runners are timed at the 100-
meter dash and are timed again one month later after following a new training program. The
times (in seconds)are shown in the table. Use Wilcoxon's signed-ranks test and a significance
level of 0.05 to test the claim that the training has no effect on the times. Before 12.1 12.4 11.7 11.5 11.0 11.8 12.3 10.8 12.6 12.7 10.7 After 11.9 12.4 11.8 11.4 11.2 11.5 12.0 10.9 12.0 12.2 11.1
(Essay)
4.8/5 (41)
Do parametric or nonparametric tests have higher efficiency ratings?
(Multiple Choice)
4.9/5 (46)
Describe the rank correlation test. What types of hypotheses is it used to test? How does the rank correlation coefficient rs differ from the Pearson correlation coefficient r?
(Essay)
4.7/5 (35)
Use the rank correlation coefficient to test for a correlation between the two variables. A placement test is required for students desiring to take a finite mathematics course at a
university. The instructor of the course studies the relationship between students' placement
test score and final course score. A random sample of eight students yields the following data. 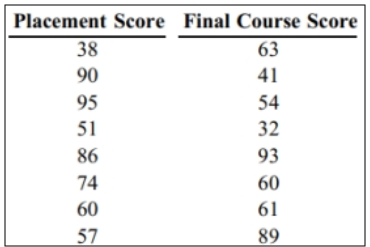 Compute the rank correlation coefficient, r_{s} , of the data and test the claim of correlation between placement score and final course score. Use a significance level of 0.05 .
(Essay)
4.8/5 (39)
Match the nonparametric test with its related parametric test.
Runs test
(Multiple Choice)
4.7/5 (33)
Filters
- Essay(0)
- Multiple Choice(0)
- Short Answer(0)
- True False(0)
- Matching(0)