Exam 13: Nonparametric Tests
Exam 1: Introduction to Statistics60 Questions
Exam 2: Exploring Data With Tables and Graphs60 Questions
Exam 3: Describing, Exploring, and Comparing Data60 Questions
Exam 4: Probability60 Questions
Exam 5: Discrete Probability Distributions60 Questions
Exam 6: Normal Probability Distributions60 Questions
Exam 7: Estimating Parameters and Determining Sample Sizes60 Questions
Exam 8: Hypothesis Testing60 Questions
Exam 9: Inferences From Two Samples60 Questions
Exam 10: Correlation and Regression60 Questions
Exam 11: Goodness-Of-Fit and Contingency Tables60 Questions
Exam 12: Analysis of Variance59 Questions
Exam 13: Nonparametric Tests60 Questions
Exam 14: Statistical Process Control60 Questions
Select questions type
Use the Wilcoxon signed -ranks test to test the claim that the matched pairs have differences that come from a population with a median equal to zero. Eleven runners are timed at the 100-
meter dash and are timed again one month later after following a new training program. The
times (in seconds)are shown in the table. Use Wilcoxon's signed-ranks test and a significance
level of 0.05 to test the claim that the training has no effect on the times. Before 12.1 12.4 11.7 11.5 11.0 11.8 12.3 10.8 12.6 12.7 10.7 After 11.9 12.4 11.8 11.4 11.2 11.5 12.0 10.9 12.0 12.2 11.1
(Essay)
4.8/5  (38)
(38)
Use a 0.05 level of significance to test the claim that the sequence of computer -generated numbers is random. Test for randomness above and below the mean.
8 7 5 7 3 9 1 8 0 4 3 8 4 6 2 3 9 7 5
(Essay)
4.9/5 (36)
Use the rank correlation coefficient to test for a correlation between the two variables. Given that the rank correlation coefficient, for 37 pairs of data is 0.324 , test the claim of correlation between the two variables. Use a significance level of 0.01 .
(Essay)
4.8/5 (33)
In a study of the effectiveness of physical exercise in weight reduction, 12 subjects followed a program of physical exercise for two months. Their weights (in pounds)before and after this program are shown in the table. Use Wilcoxon's signed -ranks test and a significance level of
0)05 to test the claim that the exercise program has no effect on weight. Before 162 190 188 152 148 127 195 164 175 156 180 136 After 157 194 179 149 135 130 183 168 168 148 170 138
What would be the signed rank for the column with values of 175 and 168 ?
(Multiple Choice)
4.8/5 (40)
Use the runs test to determine whether the given sequence is random. Use a significance level of 0.05. A sample of 30 clock radios is selected in sequence from an assembly line. Each
radio is examined and judged to be acceptable (A)or defective (D). The results are shown
below. Test for randomness. A A D A A A D A A D
A D A A A D A A A A
A A D D A A A A D A
(Essay)
4.8/5 (35)
Use the runs test to determine whether the given sequence is random. Use a significance level of 0.05 . The outcomes (odd number or even number) of a roulette wheel are shown below. Test for randomness of odd (O) and even (E) numbers. Use a significance level of 0.05 .
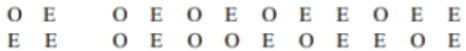 What is the value of G , the number of runs?
(Multiple Choice)
4.8/5 (37)
Describe the runs test for randomness. What types of hypotheses is it used to test? Does the runs test measure frequency? What is the underlying concept?
(Essay)
4.8/5 (28)
A teacher uses two different CAI programs to remediate a randomly selected group of students. Results for two independent samples on a standardized test are listed in a table
below. At the 0.05 level of significance, use the Wilcoxon rank-sum test to test the hypothesis
that the sample results are from populations with equal medians. 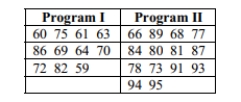
(Essay)
4.7/5 (38)
Find the critical value. Assume that the test is two -tailed and that n denotes the number of pairs of data. n=20 ,
(Multiple Choice)
4.7/5 (32)
Use a Kruskal-Wallis test to test the claim that the samples come from populations with equal medians. The table below shows the weights (in pounds)of 6 randomly selected women in
each of three different age groups. Use a 0.01 significance level to test the claim that the 3
age-groups have the same median weight. 18-34 35-55 56 and older 119 123 140 134 147 128 114 135 59 125 110 134 153 154 120 138 163 116
(Essay)
4.9/5 (37)
Use the sign test to test the indicated claim. A researcher wishes to test whether a particular diet has an effect on blood pressure. The blood pressure of 25 randomly selected adults is
measured. After one month on the diet, each person's blood pressure is again measured. For
19 people, the second blood pressure reading was lower than the first, and for 6 people, the
second blood pressure reading was higher than the first. At the 0.01 significance level, test the
claim that the diet has an effect on blood pressure.
(Essay)
4.8/5 (44)
Use a Kruskal-Wallis test to test the claim that the samples come from populations with equal medians. Listed below are grade averages for randomly selected students with three different categories of high-school background. At the 0.05 level of significance, test the claim that the three groups have the same median grade average.
HIGH SCHOOL RECORD Good Fair Poor 3.21 2.87 2.01 3.65 3.05 2.31 1.00 2.00 2.98 3.12 0.00 0.50 2.75 1.98 2.36
(Essay)
4.7/5 (29)
Use the runs test to determine whether the given sequence is random. Use a significance level of 0.05. The sequence of numbers below represents the maximum temperature (in degrees
Fahrenheit)in July in one U.S. town for 30 consecutive years. Test the sequence for
randomness above and below the median. 94 96 97 99 95 90 97 98 100 100 92 95 98 99 102 97 97 101 99 100 98 95 93 99 101 99 101 100 99 103
(Essay)
4.9/5 (43)
When applying the runs test for randomness above and below the median for 10 scores on a final exam, the test statistic is G = 2. What does that value tell us about the data?
(Essay)
4.9/5 (34)
Which of the following distribution-free tests has the lowest efficiency rating compared to its parametric counterpart?
(Multiple Choice)
4.9/5 (39)
Use a Kruskal-Wallis test to test the claim that the samples come from populations with equal medians. Listed below are grade averages for randomly selected students with three different categories of high-school background. At the 0.05 level of significance, test the claim that the three groups have the same median grade average.
HIGH SCHOOL RECORD Good Fair Poor 3.21 2.87 2.01 3.65 3.05 2.31 1.00 2.00 2.98 3.12 0.00 0.50 2.75 1.98 2.36
(Essay)
4.9/5 (39)
Use the Wilcoxon rank-sum test to test the claim that the two independent samples come from populations with equal medians. Use the Wilcoxon rank-sum approach to test the claim that the sample student grade averages at two colleges come from populations with the same median. The sample data is listed below. Use a 0.05 level of significance, and assume that the samples were randomly selected. College A 3.2 4.0 2.4 2.6 2.0 1.8 1.3 0.0 0.5 1.4 2.9 College B 2.4 1.9 0.3 0.8 2.8 3.0 3.1 3.1 3.1 3.5 3.5
(Essay)
4.7/5 (36)
Match the parametric test with its comparable nonparametric test.
1. matched pair t test
2. two independent samples t test
3. analysis of variance ( F test)
4. linear correlation
(Multiple Choice)
4.9/5 (33)
Which of the following is not an application of the sign test?
(Multiple Choice)
4.8/5 (31)
Use the sign test to test the indicated claim. An instructor gives a test before and after a lesson and results from randomly selected students are given below. At the 0.05 level of significance,
test the claim that the lesson has no effect on the grade. Use the sign test. Before 54 61 56 41 38 57 42 71 88 42 36 23 22 46 51 After 82 87 84 76 79 87 42 97 99 74 85 96 69 84 79
(Essay)
4.9/5 (39)
Filters
- Essay(0)
- Multiple Choice(0)
- Short Answer(0)
- True False(0)
- Matching(0)