Exam 12: Analysis of Variance
Exam 1: Introduction to Statistics60 Questions
Exam 2: Exploring Data With Tables and Graphs60 Questions
Exam 3: Describing, Exploring, and Comparing Data60 Questions
Exam 4: Probability60 Questions
Exam 5: Discrete Probability Distributions60 Questions
Exam 6: Normal Probability Distributions60 Questions
Exam 7: Estimating Parameters and Determining Sample Sizes60 Questions
Exam 8: Hypothesis Testing60 Questions
Exam 9: Inferences From Two Samples60 Questions
Exam 10: Correlation and Regression60 Questions
Exam 11: Goodness-Of-Fit and Contingency Tables60 Questions
Exam 12: Analysis of Variance59 Questions
Exam 13: Nonparametric Tests60 Questions
Exam 14: Statistical Process Control60 Questions
Select questions type
Test the claim that the samples come from populations with the same mean. Assume that the populations are normally distributed with the same variance. At the 0.025 significance level,
test the claim that the three brands have the same mean if the following sample results have
been obtained.
Brand A Brand B Brand C 32 27 22 34 24 25 37 33 32 33 30 22 36 21 39
(Essay)
4.8/5  (33)
(33)
The data below represent the weight losses for people on three different exercise programs Exercise A Exercise B Exercise C 2.5 5.8 4.3 8.8 4.9 6.2 7.3 1.1 5.8 9.8 7.8 8.1 5.1 1.2 7.9
If we want to test the claim that the three size categories have the same means, why don't we use three separate hypothesis tests for 1= 2, = 3 , and 1= 3 ?
(Multiple Choice)
4.9/5 (39)
Test the claim that the samples come from populations with the same mean. Assume that the populations are normally distributed with the same variance. The data below represent the
weight losses for people on three different exercise programs. Exercise A Exercise B Exercise C 2.5 5.8 4.3 8.8 4.9 6.2 7.3 1.1 5.8 9.8 7.8 8.1 5.1 1.2 7.9 At the 1% significance level, does it appear that a difference exists in the true mean weight loss produced by the three exercise programs?
(Essay)
4.8/5 (39)
Fill in the missing entries in the following partially completed one-way ANOVA table
Source Treatment 3 14.28 Error 13.50 0.643 Total
(Essay)
4.8/5 (37)
Why do researchers concentrate on explaining an interaction in a two -way ANOVA rather than the effects of each factor separately?
(Essay)
4.9/5 (34)
Explain the procedure for two-way analysis of variance varies depending on whether there is an interaction between the two factors or not.
(Essay)
4.9/5 (40)
Given below are the analysis of variance results from a Minitab display. to use a 0.05 significance level in testing the null hypothesis that the different samples come from populations with the same mean. Identify the p-value. Source Factor 3 30 10.00 1.6 0.264 Error 8 50 6.25 Total 11 80
(Multiple Choice)
4.8/5 (36)
Use the data in the given table and the corresponding Minitab display to test the hypothesis. The following table entries are test scores for males and females at different times of day.
Assuming no effect from the interaction between gender and test time, test the claim that time
of day does not affect test scores. Use a 0.05 significance level. 6 a.m. -9 a.m. 9 a.m. -12 p.m. 12 p.m. -3 p.m. 3 p.m. -6 p.m. Male 87 89 92 85 Female 72 84 94 89
Source DF SS MS F p Gender 1 24.5 24.5 0.6652 0.4745 Time 3 183 61 1.6561 0.3444 Error 3 110.5 36.83 Total 7 318
(Essay)
4.8/5 (35)
The test statistics for one-way ANOVA is
Describe variance within samples and variance between samples. What relationship does variance within samples and variance between samples would result in the conclusion that the value of F is significant?
(Essay)
4.9/5 (37)
Use the Minitab display to test the indicated claim. A manager records the production output of three employees who each work on three different machines for three different days. The
sample results are given below and the Minitab results follow. 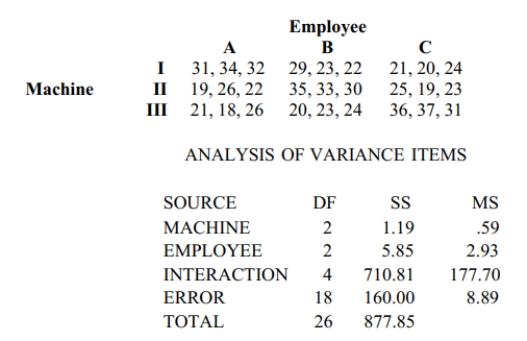 Assume that the number of items produced is not affected by an interaction between
employee and machine. Using a 0.05 significance level, test the claim that the choice of
employee has no effect on the number of items produced.
Assume that the number of items produced is not affected by an interaction between
employee and machine. Using a 0.05 significance level, test the claim that the choice of
employee has no effect on the number of items produced.
(Essay)
4.7/5 (38)
Use the data in the given table and the corresponding Minitab display to test the hypothesis. The following table shows the mileage for four different cars and three different brands of gas. Assuming no effect from the interaction between car and brand of gas, test the claim that the four cars have the same mean mileage. Use a 0.05 significance level. Brand 1 Brand 2 Brand 3 Car 1 22.4 25.2 24.3 Car 2 19 18.6 19.8 Car 3 24.6 25 25.4 Car 4 23.5 23.6 24.1 Source DF SS MS F p Car 3 61.249 20.416 39.033 0.000249 Gas 2 2.222 1.111 2.124 0.200726 Error 6 3.138 0.523 Total 11 66.609
(Essay)
4.7/5 (43)
Test the claim that the samples come from populations with the same mean. Assume that the populations are normally distributed with the same variance. At the 0.025 significance level, test the claim that the three brands have the same mean if the following sample results have been obtained.
Brand A Brand B Brand C 32 27 22 34 24 25 37 33 32 33 30 22 36 21 39
(Essay)
4.9/5 (47)
Use the data in the given table and the corresponding Minitab display to test the hypothesis. The following Minitab display results from a study in which three different teachers taught calculus classes of five different sizes. The class average was recorded for each class. Assuming no effect from the interaction between teacher and class size, test the claim that the teacher has no effect on the class average. Use a 0.05 significance level.
Source DF Teacher 2 56.93 28.47 1.018 0.404 Class Size 4 672.67 168.17 6.013 0.016 Error 8 223.73 27.97 Total 14 953.33
(Essay)
4.7/5 (39)
At the same time each day, a researcher records the temperature in each of three greenhouses. The table shows the temperatures in degrees Fahrenheit recorded for one week.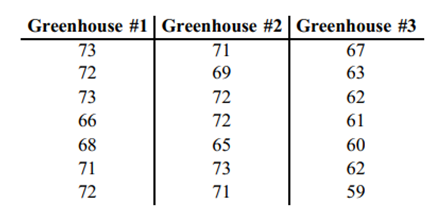 What type of test would you use to test the claim that the average temperature is the same in each greenhouse at a 0.05 significance level?
(Multiple Choice)
4.8/5 (34)
The following data contains task completion times, in minutes, categorized according to the gender of the machine operator and the machine used. Male Female Machine 1 15,17 16,17 Machine 2 14,13 15,13 Machine 3 16,18 17,19
Assume that two-way ANOVA is used to analyze the data. How are the ANOVA results
affected if 5 minutes is added to each completion time?
(Essay)
4.7/5 (43)
The following data contains task completion times, in minutes, categorized according to the gender of the machine operator and the machine used.
Male Female Machine 1 15,17 16,17 Machine 2 14,13 15,13 Machine 3 16,18 17,19
Assume that two-way ANOVA is used to analyze the data. How are the ANOVA results affected if the times are converted to hours?
(Essay)
4.9/5 (43)
Use the Minitab display to test the indicated claim. A manager records the production output of three employees who each work on three different machines for three different days. The sample results are given below and the Minitab results follow. 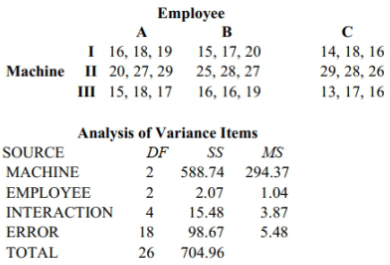 Assume that the number of items produced is not affected by an interaction between employee and machine. Using a 0.05 significance level, test the claim that the choice of employee has no effect on the number of items produced. What is the value of the test statistic, F ?
(Multiple Choice)
4.8/5 (39)
The test statistic for one-way ANOVA is equal to _________________.
(Multiple Choice)
4.8/5 (39)
Test the claim that the samples come from populations with the same mean. Assume that the populations are normally distributed with the same variance. Given the sample data below, test the claim that the populations have the same mean. Use a significance level of 0.05. Brand A Brand B Brand C n=10 n=10 n=10 =32.1 =32.6 =27.2 =4.37 =3.61 =3.34
(Essay)
4.8/5 (39)
Filters
- Essay(0)
- Multiple Choice(0)
- Short Answer(0)
- True False(0)
- Matching(0)