Exam 12: Analysis of Variance
Exam 1: Introduction to Statistics60 Questions
Exam 2: Exploring Data With Tables and Graphs60 Questions
Exam 3: Describing, Exploring, and Comparing Data60 Questions
Exam 4: Probability60 Questions
Exam 5: Discrete Probability Distributions60 Questions
Exam 6: Normal Probability Distributions60 Questions
Exam 7: Estimating Parameters and Determining Sample Sizes60 Questions
Exam 8: Hypothesis Testing60 Questions
Exam 9: Inferences From Two Samples60 Questions
Exam 10: Correlation and Regression60 Questions
Exam 11: Goodness-Of-Fit and Contingency Tables60 Questions
Exam 12: Analysis of Variance59 Questions
Exam 13: Nonparametric Tests60 Questions
Exam 14: Statistical Process Control60 Questions
Select questions type
Fill in the missing entries in the following partially completed one -way ANOVA table. Source d = /df -statistic Treatment 3 11.16 Error 13.72 0.686
(Multiple Choice)
4.8/5  (30)
(30)
Identify the value of the test statistic. Source Factor 3 30 10.00 1.6 0.264 Error 8 50 6.25 Total 11 80
(Multiple Choice)
4.7/5 (33)
Test the claim that the samples come from populations with the same mean. Assume that the populations are normally distributed with the same variance. Exercise A Exercise B Exercise 2.5 5.8 4.3 8.8 4.9 6.2 7.3 1.1 5.8 9.8 7.8 8.1 5.1 1.2 7.9
At the 1% significance level, does it appear that a difference exists in the true mean weight loss produced by the three exercise programs?
(Essay)
4.9/5 (36)
Given below are the analysis of variance results from a Minitab display. to use a 0.05 significance level in testing the null hypothesis that the different samples come from populations with the same mean. Identify the P-value. Source Factor 3 13.500 4.500 5.17 0.011 Error 16 13.925 0.870 Total 19 27.425
(Multiple Choice)
4.8/5 (42)
Which of the following is NOT a requirement for one-way ANOVA?
(Multiple Choice)
4.9/5 (33)
Given below are the analysis of variance results from a Minitab display. to use a 0.05 significance level in testing the null hypothesis that the different samples come from populations with the same mean. What can you conclude about the equality of the
Population means? Source Factor 3 13.500 4.500 5.17 0.011 Error 16 13.925 0.870 Total 19 27.425
(Multiple Choice)
4.9/5 (33)
Explain the procedure for two-way analysis of variance, and how it varies depending on whether there is an interaction between the two factors or not.
(Essay)
4.9/5 (34)
Given below are the analysis of variance results from a Minitab display. to use a 0.05 significance level in testing the null hypothesis that the different samples come from populations with the same mean. Identify the value of the test statistic. Source Factor 3 13.500 4.500 5.17 0.011 Error 16 13.925 0.870 Total 19 27.425
(Multiple Choice)
4.9/5 (38)
The data below represent the weight losses for people on three diets
Diet A Diet B Diet C 1.75 3.8 4.8 8.8 4.9 6.2 7.3 1.1 5.8 9.8 7.8 8.1 5.1 1.2 6.9
If we want to test the claim that the three size categories have the same means, why don't we use three separate hypothesis tests for
(Essay)
4.9/5 (43)
The following data contains task completion times, in minutes, categorized according to the gender of the machine operator and the machine used. 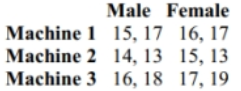 The ANOVA results lead us to conclude that the completion times are not affected by an interaction between machine and gender, and the times are not affected by gender, but they are affected by the machine. Change the table entries so that there is an effect from the interaction between machine and gender.
(Essay)
5.0/5 (35)
Assume that the number of items produced is not affected by an interaction between employee and machine. Using a 0.05 significance level, test the claim that the machine has no effect on
the number of items produced. 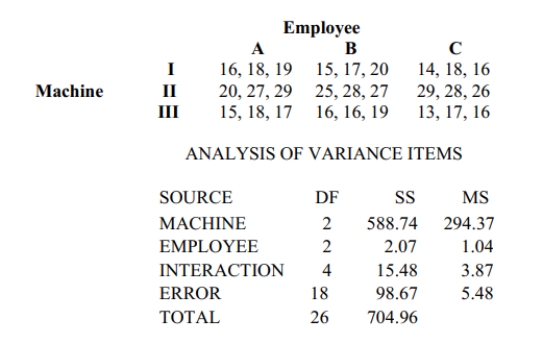 Using a 0.05 significance level, test the claim that the interaction between employee and
machine has no effect on the number of items produced.
Using a 0.05 significance level, test the claim that the interaction between employee and
machine has no effect on the number of items produced.
(Essay)
4.7/5 (41)
Draw an example of an F distribution and list the characteristics of the F distribution
(Essay)
4.8/5 (34)
The following data contains task completion times, in minutes, categorized according to the gender of the machine operator and the machine used.
Male Female Machine 1 15,17 16,17 Machine 2 14,13 15,13 Machine 3 16,18 17,19
The ANOVA results lead us to conclude that the completion times are not affected by an interaction between machine and gender, and the times are not affected by gender, but they are affected by the machine. Change the table entries so that there is no effect from the interaction between machine and gender, but there is an effect from the gender of the operator.
(Essay)
4.8/5 (35)
Select an appropriate null hypothesis for a one way analysis of variance test.
(Multiple Choice)
4.7/5 (45)
Test the claim that the samples come from populations with the same mean. Assume that the populations are normally distributed with the same variance. At the 0.025 significance level, test the claim that the four brands have the same mean if the following sample results havebeen obtained. Brand A Brand B Brand C Brand D 17 18 21 22 20 18 24 25 21 23 25 27 22 25 26 29 21 26 29 35 29 36 37
(Essay)
4.8/5 (33)
The following data shows the yield, in bushels per acre, categorized according to three varieties of corn and three different soil conditions. Assume that yields are not affected by an interaction between variety and soil conditions, and test the null hypothesis that variety has no effect on yield. Use a 0.05 significance level.
Plot 1 Plot 2 Plot 3 Variety 1 156,167, 162,160, 145,151, 170,162 169,168 148,155 Variety 2 172,176, 179,186, 161,162, 166,179 160,176 165,170 Variety 3 175,157, 178,170, 169,165, 179,178 172,174 170,169
(Essay)
4.8/5 (30)
Fill in the missing entries in the following partially completed one-way ANOVA table
Source Treatment 3 13.89 Error 13.58 0.617 Total
(Essay)
4.9/5 (34)
At the same time each day, a researcher records the temperature in each of three greenhouses. The table shows the temperatures in degrees Fahrenheit recorded for one week.
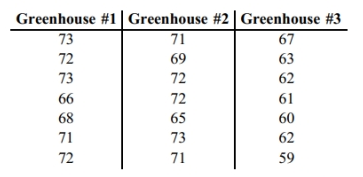 i) Use a 0.05 significance level to test the claim that the average temperature is the same in each greenhouse.
ii) How are the analysis of variance results affected if the same constant is added to every one of the original sample values?
i) Use a 0.05 significance level to test the claim that the average temperature is the same in each greenhouse.
ii) How are the analysis of variance results affected if the same constant is added to every one of the original sample values?
(Essay)
4.9/5 (40)
Filters
- Essay(0)
- Multiple Choice(0)
- Short Answer(0)
- True False(0)
- Matching(0)