Exam 2: Exploring Data With Tables and Graphs
Exam 1: Introduction to Statistics60 Questions
Exam 2: Exploring Data With Tables and Graphs60 Questions
Exam 3: Describing, Exploring, and Comparing Data60 Questions
Exam 4: Probability60 Questions
Exam 5: Discrete Probability Distributions60 Questions
Exam 6: Normal Probability Distributions60 Questions
Exam 7: Estimating Parameters and Determining Sample Sizes60 Questions
Exam 8: Hypothesis Testing60 Questions
Exam 9: Inferences From Two Samples60 Questions
Exam 10: Correlation and Regression60 Questions
Exam 11: Goodness-Of-Fit and Contingency Tables60 Questions
Exam 12: Analysis of Variance59 Questions
Exam 13: Nonparametric Tests60 Questions
Exam 14: Statistical Process Control60 Questions
Select questions type
The weights (in pounds)of 22 members of the junior varsity football team are listed below. 144 152 142 151 160 152 131 164 141 153 140
144 175 156 147 133 172 159 135 159 148 171
Which of these choices display the correct stemplot?
(Multiple Choice)
4.8/5  (29)
(29)
A nurse measured the blood pressure of each person who visited her clinic. Following is a relative-frequency histogram for the systolic blood pressure readings for those people aged between 25 and 40 years. The blood pressure readings (in mm Hg)were given to the Nearest whole number. What class width was used to construct the relative frequency
Distribution? 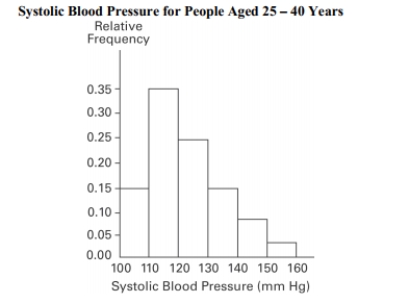
(Multiple Choice)
4.9/5 (30)
The following figures represent Latisha's monthly charges (in $)for long distance telephone calls for the past twelve months. 7.12 10.40 14.70 18.24 10.48 16.47 7.53 15.45 13.04 15.48 13.33 12.56
Construct a frequency distribution with four classes.
(Essay)
4.9/5 (36)
The frequency distribution below summarizes the home sale prices in the city of Summerhill for the month of June. Determine the class midpoint (in thousand $)for the class 235.0 -265.9.
(Multiple Choice)
4.8/5 (36)
Describe at least two advantages to using stemplots rather than frequency distributions.
(Essay)
4.9/5 (32)
The following data show the number of laps run by each participant in a marathon. 46 65 55 43 51 48 57 30 43 49 32 56
Which of these choices display the correct stemplot?
(Multiple Choice)
4.8/5 (31)
The following data consists of the weights (in pounds)of 15 randomly selected women and the weights of 15 randomly selected men. Which of these choices display the correct back- to-back stemplot? Women: 128 150 118 166 142 122 137 110 175 152 145 126 139 111 170 Men: 140 153 199 186 169 136 176 162 196 155 173 190 141 166 153
(Multiple Choice)
4.7/5 (32)
The frequency distribution below summarizes employee years of service for Alpha Corporation. Find the class midpoint for class 1 -5. Years of Service Frequency 1-5 5 6-10 20 11-15 25 16-20 10 21-25 5 26-30 3
(Multiple Choice)
4.9/5 (36)
The frequency distribution below summarizes the home sale prices in the city of Summerhill for the month of June. Determine the width of each class.
(Multiple Choice)
4.9/5 (34)
Explain in your own words why a bar graph can be misleading if one or both of the scales begin at some value other than zero.
(Essay)
4.8/5 (30)
Kevin asked some of his friends how many hours they had worked during the previous week at their after-school jobs. The results are shown below. 5 6 5 4 5 5 9 8 5 3 7 6 6 7 5 6 7 5 6 8 6 7 8 4
Construct a frequency distribution. Use 4 classes, a class width of 2 hours, and a lower limit of 3 for class
(Essay)
4.9/5 (29)
Smoking and the episodes of lung cancer have a high correlation, but it does not prove _________.
(Multiple Choice)
4.9/5 (44)
The following data represent the number of cars passing through a toll booth during a certain time period over a number of days. 38 39 37 37 44 38 41 38 39 35 42 39 43 37 41
Which of these choices display the correct dotplot?
(Multiple Choice)
4.8/5 (32)
The graph below shows the number of car accidents occurring in one city in each of the years 2011 through 2016. The number of accidents dropped in 2013 after a new speed limit
was imposed. Does the graph distort the data? How would you redesign the graph to be less
misleading? 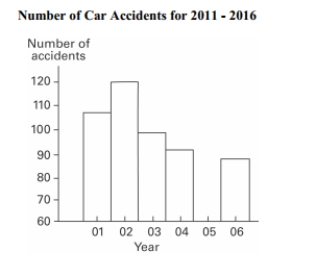
(Essay)
4.9/5 (33)
A store manager counts the number of customers who make a purchase in his store each day. The data are as follows. 10 11 8 14 7 10 10 11 8 7
Which of these choices display the correct dotplot?
(Multiple Choice)
4.8/5 (35)
The attendance counts for this season's basketball games are listed below. Which of these choices display the correct stemplot? 227 239 215 219
221 233 229 233
235 228 245 231
(Multiple Choice)
4.8/5 (41)
Describe how a data point labeled as an outlier can affect the analysis of a data set in a frequency distribution or histogram.
(Essay)
4.8/5 (35)
The two key parts of a regression equation involve the ____________ and the y-____________.
(Multiple Choice)
4.9/5 (36)
The frequency distribution below summarizes employee years of service for Alpha Corporation. Determine the width of each class. Years of Service Frequency 1-5 5 6-10 20 11-15 25 16-20 10 21-25 5 26-30 3
(Multiple Choice)
4.8/5 (30)
A manufacturer records the number of errors each work station makes during the week. The data are as follows. 6 3 2 3 5 2 0 2 5 4 2 0 1
Which of these choices display the correct dotplot?
(Multiple Choice)
4.9/5 (37)
Filters
- Essay(0)
- Multiple Choice(0)
- Short Answer(0)
- True False(0)
- Matching(0)