Exam 3: Graphs and Functions
Exam 1: Review of Basic Concepts637 Questions
Exam 2: Equations and Inequalities498 Questions
Exam 3: Graphs and Functions531 Questions
Exam 4: Polynomials and Rational Functions517 Questions
Exam 5: Inverse, Exponential, and Logarithmic Functions472 Questions
Exam 6: Systems and Matrices505 Questions
Exam 7: Arithmetic Sequence: Common Difference and First n Terms570 Questions
Select questions type
Write an equation for the line described. Give your answer in slope-intercept form.
- , through
(Multiple Choice)
4.9/5  (40)
(40)
A circle has a diameter with endpoints and . Find the coordinates of the center.
(Multiple Choice)
4.8/5 (43)
Describe how the graph of the equation relates to the graph of y .
-
![Describe how the graph of the equation relates to the graph of y y = \sqrt [ 3 ] { x } . - y=x^{2}-5](https://storage.examlex.com/TB7516/11ecc545_6e5c_4a6c_8347_1f9a50cb8e45_TB7516_11.jpg)
(Multiple Choice)
4.8/5 (43)
The line graph shows the recorded hourly temperatures in degrees Fahrenheit at an airport. 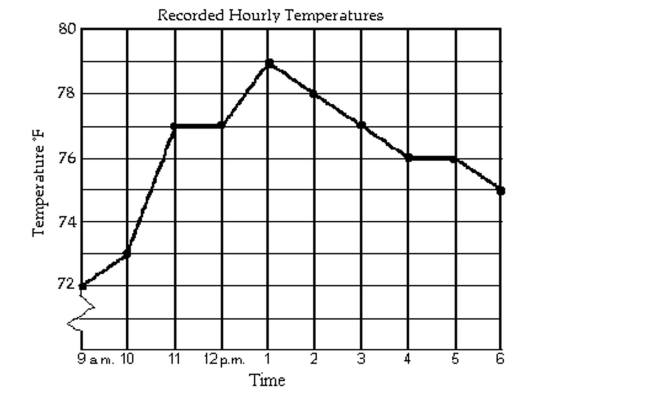 -During which hour did the temperature increase the most?
(Multiple Choice)
4.9/5 (27)
Decide whether the relation defines a function.
- Student Test Score Name Test Score Bob L. 85 Susan H. 83 Jim H. 85 Bruce B. 96
(Multiple Choice)
4.9/5 (43)
Describe how the graph of the equation relates to the graph
-
(Multiple Choice)
4.8/5 (28)
Find the slope of the line satisfying the given conditions.
-through and
(Multiple Choice)
4.8/5 (36)
For the given functions f and g , find the indicated composition.
-
(Multiple Choice)
4.9/5 (34)
Match the description with the correct symbolic expression.
-a linear equation whose graph has -intercept and -intercept 11
(Multiple Choice)
4.9/5 (37)
Give a rule for the piecewise-defined function. Then give the domain and range.
-
(Multiple Choice)
4.8/5 (39)
Determine the intervals of the domain over which the function is continuous.
-
(Multiple Choice)
4.7/5 (28)
A new chocolate company is estimating how many candy bars per week college students will consume of their line of
products. The graph shows the probable number of candy bars students (age 18-22) will consume from year 0 to year 10.
B(x) gives the number of candy bars for boys, G(x) gives the number of candy bars for girls, and T(x) gives the total
number for both groups. Use the graph to answer the question. 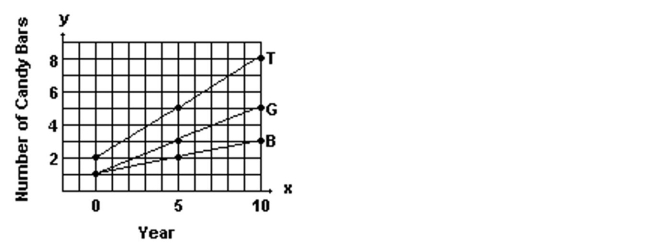 -The cost of manufacturing clocks is given by . Also, it is known that in thours the number of clocks that can be produced is given by , where . Express as a function of .
(Multiple Choice)
4.9/5 (43)
Describe the transformations and give the equation for the graph.
-Find when and
(Multiple Choice)
4.7/5 (38)
Find the coordinates of the other endpoint of the segment, given its midpoint and one endpoint.
-midpoint (-8, 7), endpoint (-4, 6)
(Multiple Choice)
4.9/5 (40)
Filters
- Essay(0)
- Multiple Choice(0)
- Short Answer(0)
- True False(0)
- Matching(0)