Exam 3: Graphs and Functions
Exam 1: Review of Basic Concepts637 Questions
Exam 2: Equations and Inequalities498 Questions
Exam 3: Graphs and Functions531 Questions
Exam 4: Polynomials and Rational Functions517 Questions
Exam 5: Inverse, Exponential, and Logarithmic Functions472 Questions
Exam 6: Systems and Matrices505 Questions
Exam 7: Arithmetic Sequence: Common Difference and First n Terms570 Questions
Select questions type
A new chocolate company is estimating how many candy bars per week college students will consume of their line of
products. The graph shows the probable number of candy bars students (age 18-22) will consume from year 0 to year 10.
B(x) gives the number of candy bars for boys, G(x) gives the number of candy bars for girls, and T(x) gives the total
number for both groups. Use the graph to answer the question. 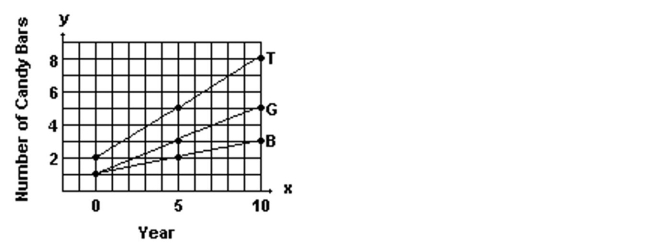 -Estimate B(4) and G(4) and use your estimates to estimate T(4).
(Multiple Choice)
4.8/5  (40)
(40)
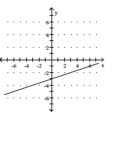
The graph of a linear function f is shown. Write the equation that defines f. Write the equation in slope-intercept form.
-
(Multiple Choice)
4.8/5 (37)
Provide an appropriate response.
-Are the points A(3, 6), B(6, 9), C( 8, 1), and D(11, 4) the vertices of a parallelogram (opposite sides equal in length)? of a rhombus (all sides equal in length)?
(Multiple Choice)
4.9/5 (34)
Describe how the graph of the equation relates to the graph of y .
-
![Describe how the graph of the equation relates to the graph of y y = \sqrt [ 3 ] { x } . - f(x)=3 \sqrt{x}](https://storage.examlex.com/TB7516/11ecc544_03df_3392_8347_6fb0f23ff540_TB7516_11.jpg)
(Multiple Choice)
4.9/5 (27)
Find the average rate of change illustrated in the graph.
-From April through December, the stock price of QRS Company had a roller coaster ride. The chart below indicates the price of the stock at the beginning of each month during that period. Find the average rate of change in price per month
Between June and September. Round to the nearest cent. Month Price April (x=1) 115 May 108 June 89 July 99 August 96 September 111 October 92 November 84 December 66
(Multiple Choice)
4.9/5 (25)
Graph the equation by determining the missing values needed to plot the ordered pairs.
-
(Multiple Choice)
4.9/5 (35)
For the points P and Q, find the coordinates of the midpoint of the segment PQ.
-
(Multiple Choice)
4.9/5 (42)
Find the average rate of change illustrated in the graph.
- Year
Year
(Multiple Choice)
5.0/5 (30)
Provide an appropriate response.
-If the point (a, b) is in the fourth quadrant, in what quadrant is (a,
(Multiple Choice)
4.8/5 (34)
Determine whether the three points are the vertices of a right triangle.
-
(True/False)
4.8/5 (35)
Graph the point symmetric to the given point.
-Plot the point (9, 6), then plot the point that is symmetric to (9, 6) with respect to the x-axis. 
(Multiple Choice)
4.8/5 (28)
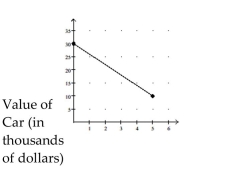
Find the average rate of change illustrated in the graph.
-An investment is worth $3539 in year 0, the initial investment year. By year 3 its value has increased to $4964. Let y be the value of the investment in the year x. Find and interpret the average rate of change in value per
Year.
(Multiple Choice)
4.8/5 (34)
Write an equation for the line described. Give your answer in standard form.
-through , undefined slope
(Multiple Choice)
4.8/5 (34)
Give the domain and range of the relation.
-Annual New Telemarketing Companies Year Number 1995 56 1996 112 1997 187 1998 178 1999 318
(Multiple Choice)
4.8/5 (36)
Match the description with the correct symbolic expression.
-a horizontal line
(Multiple Choice)
4.8/5 (39)
Find the slope of the line satisfying the given conditions.
-through and
(Multiple Choice)
4.9/5 (40)
Find the average rate of change illustrated in the graph.
-A deep sea diving bell is being lowered at a constant rate. After 12 minutes, the bell is at a depth of 300 ft. After 50 minutes the bell is at a depth of 1500 ft. What is the average rate of change of depth? Round to one decimal
Place.
(Multiple Choice)
4.9/5 (32)
Describe how the graph of the equation relates to the graph of y .
-
![Describe how the graph of the equation relates to the graph of y y = \sqrt [ 3 ] { x } . - g ( x ) = - \sqrt { x + 2 } - 2](https://storage.examlex.com/TB7516/11ecc547_581d_562c_8347_bdf922a259e6_TB7516_11.jpg)
(Multiple Choice)
4.7/5 (30)
Filters
- Essay(0)
- Multiple Choice(0)
- Short Answer(0)
- True False(0)
- Matching(0)