Exam 3: Graphs and Functions
Exam 1: Review of Basic Concepts637 Questions
Exam 2: Equations and Inequalities498 Questions
Exam 3: Graphs and Functions531 Questions
Exam 4: Polynomials and Rational Functions517 Questions
Exam 5: Inverse, Exponential, and Logarithmic Functions472 Questions
Exam 6: Systems and Matrices505 Questions
Exam 7: Arithmetic Sequence: Common Difference and First n Terms570 Questions
Select questions type
Find the average rate of change illustrated in the graph.
-The linear function models the percentage of people, , who graduated from college years after 1998. Find and interpret the slope.
(Multiple Choice)
4.9/5  (36)
(36)
Find the slope of the line satisfying the given conditions.
-through and
(Multiple Choice)
4.7/5 (31)
Give a rule for the piecewise-defined function. Then give the domain and range.
-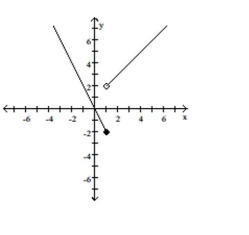
(Multiple Choice)
4.9/5 (29)
Write an equation for the line described. Write the equation in the form specified.
-perpendicular to , through ; standard form
(Multiple Choice)
4.7/5 (38)
Write an equation for the line described. Give your answer in slope-intercept form.
-through and
(Multiple Choice)
4.7/5 (40)
Find the center-radius form of the circle described or graphed.
-a circle having a diameter with endpoints and
(Multiple Choice)
4.8/5 (34)
The figure below shows the graph of a functio e this graph to
-
(Multiple Choice)
4.9/5 (40)
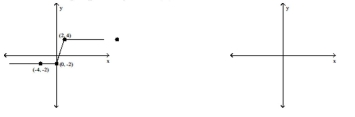
Give a rule for the piecewise-defined function. Then give the domain and range.
-
(Multiple Choice)
4.9/5 (36)
Describe how the graph of the equation relates to the graph of y .
-
![Describe how the graph of the equation relates to the graph of y y = \sqrt [ 3 ] { x } . - y = \frac { 1 } { 3 } ( x - 4 ) ^ { 3 }](https://storage.examlex.com/TB7516/11ecc546_a940_c77e_8347_7784e3ef9ef4_TB7516_11.jpg)
(Multiple Choice)
4.7/5 (36)
Describe how the graph of the equation relates to the graph of y .
-
![Describe how the graph of the equation relates to the graph of y y = \sqrt [ 3 ] { x } . - f ( x ) = 3 ( x + 1 ) ^ { 2 } - 2](https://storage.examlex.com/TB7516/11ecc546_bfb6_98a3_8347_6561e1c250f6_TB7516_00.jpg)
(Multiple Choice)
4.7/5 (35)
The table lists how financial aid income cutoffs (in dollars) for a family of four have changed over time. Use the midpoint formula to approximate the financial aid cutoff for 1985. Year Income (in dollars) 1960 20,250 1970 25,500 1980 30,750 1990 36,000 2000 41,250
(Multiple Choice)
4.7/5 (36)
Use the graph to determine the equation of the circle in center-radius form.
-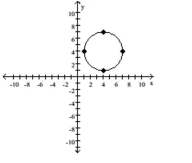
(Multiple Choice)
4.9/5 (32)
Filters
- Essay(0)
- Multiple Choice(0)
- Short Answer(0)
- True False(0)
- Matching(0)