Exam 3: Graphs and Functions
Exam 1: Review of Basic Concepts637 Questions
Exam 2: Equations and Inequalities498 Questions
Exam 3: Graphs and Functions531 Questions
Exam 4: Polynomials and Rational Functions517 Questions
Exam 5: Inverse, Exponential, and Logarithmic Functions472 Questions
Exam 6: Systems and Matrices505 Questions
Exam 7: Arithmetic Sequence: Common Difference and First n Terms570 Questions
Select questions type
Graph the equation by determining the missing values needed to plot the ordered pairs.
-
(Multiple Choice)
4.8/5  (30)
(30)
Find the average rate of change illustrated in the graph.
- Time (in seconds)
(Multiple Choice)
4.9/5 (33)
Describe how the graph of the equation relates to the graph of y .
-
![Describe how the graph of the equation relates to the graph of y y = \sqrt [ 3 ] { x } . - g ( x ) = \frac { 1 } { 3 } | x + 4 | + 5](https://storage.examlex.com/TB7516/11ecc547_853a_1996_8347_81796fe80b72_TB7516_11.jpg)
(Multiple Choice)
4.9/5 (32)
Determine whether the equation has a graph that is symmetric with respect to the y-axis, the x-axis, the origin, or none of
these.
-
(Multiple Choice)
4.8/5 (27)
Write an equation for the line described. Give your answer in slope-intercept form.
-
(Multiple Choice)
4.8/5 (24)
Suppose the point (2, 4) is on the graph of y . Find a point on the graph of the given function.
-The reflection of the graph of across the -axis
(Multiple Choice)
4.9/5 (41)
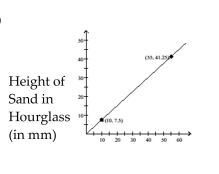
Find the average rate of change illustrated in the graph.
-Along with incomes, people's charitable contributions have steadily increased over the past few years. The table below shows the average deduction for charitable contributions reported on individual income tax returns over 6 years. Find
The average rate of change per year between year 3 and year 5. Year Charitable Contributions 1 \ 1970 2 \ 2430 3 \ 2460 4 \ 2810 5 \ 3050 6 \ 3180
(Multiple Choice)
4.8/5 (25)
Determine whether the three points are the vertices of a right triangle.
-
(True/False)
4.9/5 (34)
Find the slope of the line satisfying the given conditions.
-through (9, -4) and (-6, -7)
(Multiple Choice)
4.7/5 (38)
Describe how the graph of the equation relates to the graph of y .
-
![Describe how the graph of the equation relates to the graph of y y = \sqrt [ 3 ] { x } . - h ( x ) = \sqrt { - x + 2 } - 1](https://storage.examlex.com/TB7516/11ecc547_6fb9_08b1_8347_7149fe73df02_TB7516_00.jpg)
(Multiple Choice)
4.8/5 (39)
Suppose a life insurance policy costs $20 for the first unit of coverage and then $5 for each additional unit of coverage. Let C(x) be the cost for insurance of x units of coverage. What will 10 units of coverage cost?
(Multiple Choice)
4.7/5 (29)
The table shows enrollment in 2-year technical schools for 1980, 1990 and 2000. Assuming a linear relationship, estimate the enrollment for 1995. Year Enrollment (in millions) 1980 2.3 1990 2.9 2000 3.5
(Multiple Choice)
4.9/5 (35)
Write an equation for the line described. Give your answer in slope-intercept form.
-vertical, through (3, 4)
(Multiple Choice)
4.7/5 (36)
Match the description with the correct symbolic expression.
-a linear function whose graph has -intercept
(Multiple Choice)
4.7/5 (40)
A new chocolate company is estimating how many candy bars per week college students will consume of their line of
products. The graph shows the probable number of candy bars students (age 18-22) will consume from year 0 to year 10.
B(x) gives the number of candy bars for boys, G(x) gives the number of candy bars for girls, and T(x) gives the total
number for both groups. Use the graph to answer the question. 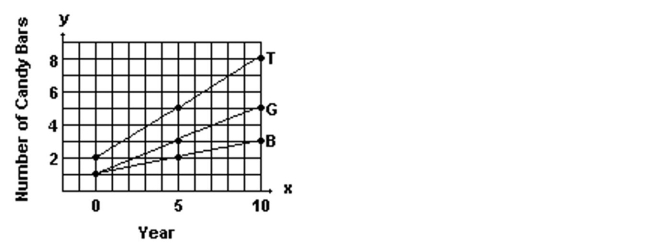 -A furniture store buys 45 footstools from a distributor at a cost of $230 each plus an overhead charge of $45 per order. The retail markup is 25% on the total price paid. Find the profit on the sale of one footstool.
(Multiple Choice)
4.8/5 (30)
Filters
- Essay(0)
- Multiple Choice(0)
- Short Answer(0)
- True False(0)
- Matching(0)