Exam 3: Graphs and Functions
Exam 1: Review of Basic Concepts637 Questions
Exam 2: Equations and Inequalities498 Questions
Exam 3: Graphs and Functions531 Questions
Exam 4: Polynomials and Rational Functions517 Questions
Exam 5: Inverse, Exponential, and Logarithmic Functions472 Questions
Exam 6: Systems and Matrices505 Questions
Exam 7: Arithmetic Sequence: Common Difference and First n Terms570 Questions
Select questions type
For the pair of functions, find the indicated sum, difference, product, or quotient.
-
Find .
(Multiple Choice)
4.9/5  (37)
(37)
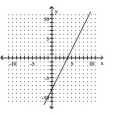
The graph of a linear function f is shown. Identify the slope, y-intercept, and x-intercept.
-
(Multiple Choice)
4.7/5 (33)
For the points P and Q, find the coordinates of the midpoint of the segment PQ.
-
(Multiple Choice)
5.0/5 (36)
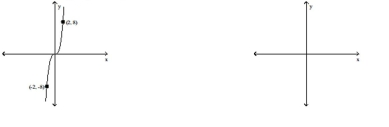
Determine whether the equation has a graph that is symmetric with respect to the y-axis, the x-axis, the origin, or none of
these.
-
(Multiple Choice)
4.9/5 (38)
The figure below shows the graph of a functio e this graph to
-
(Multiple Choice)
4.7/5 (33)
Use the graph to solve the problem.
-The height h in feet of a projectile thrown upward from the roof of a building after time t seconds is shown in the graph below. How high will the projectile be after 2 s? 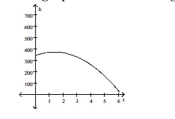
(Multiple Choice)
5.0/5 (31)
Describe how the graph of the equation relates to the graph
-
(Multiple Choice)
4.9/5 (31)
A new chocolate company is estimating how many candy bars per week college students will consume of their line of
products. The graph shows the probable number of candy bars students (age 18-22) will consume from year 0 to year 10.
B(x) gives the number of candy bars for boys, G(x) gives the number of candy bars for girls, and T(x) gives the total
number for both groups. Use the graph to answer the question. 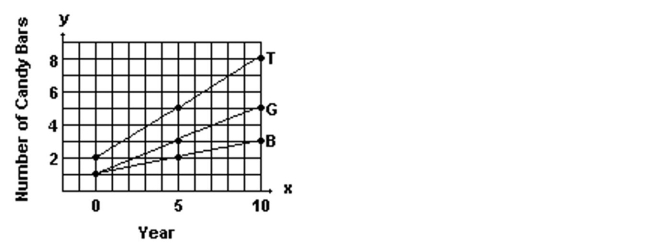 -Estimate B(7) and G(7) and use your estimates to estimate T(7).
(Multiple Choice)
4.7/5 (34)
Describe how the graph of the equation relates to the graph of y .
-
(Multiple Choice)
4.8/5 (41)
Find the average rate of change illustrated in the graph.
-Regrind, Inc. regrinds used typewriter platens. The variable cost to regrind each platen is $1.30. The total cost to regrind 110 platens is $500. Find the linear cost function to regrind platens. If reground platens sell for $9.60
Each, how many must be reground and sold to break even?
(Multiple Choice)
4.8/5 (36)
Write all linear equations in slope-intercept form.
-The amount of time t it takes a flame to go out in a closed container is a linear function of the volume of the container x. A flame in 798 mL container takes 14 seconds to go out and a flame in a 1344 mL container takes
27 seconds. Write a linear function that relates t to x.
(Multiple Choice)
4.8/5 (31)
Filters
- Essay(0)
- Multiple Choice(0)
- Short Answer(0)
- True False(0)
- Matching(0)