Exam 3: Graphs and Functions
Exam 1: Review of Basic Concepts637 Questions
Exam 2: Equations and Inequalities498 Questions
Exam 3: Graphs and Functions531 Questions
Exam 4: Polynomials and Rational Functions517 Questions
Exam 5: Inverse, Exponential, and Logarithmic Functions472 Questions
Exam 6: Systems and Matrices505 Questions
Exam 7: Arithmetic Sequence: Common Difference and First n Terms570 Questions
Select questions type
Write an equation for the line described. Give your answer in slope-intercept form.
-
Free
(Multiple Choice)
4.8/5  (40)
(40)
Correct Answer: Verified
C
Graph the line described.
-through
Free
(Multiple Choice)
4.7/5 (33)
Correct Answer:Verified
B
Decide whether the relation defines a function.
-
Free
(Multiple Choice)
4.9/5 (36)
Correct Answer:Verified
B
For the points P and Q, find the coordinates of the midpoint of the segment PQ.
-
(Multiple Choice)
4.8/5 (40)
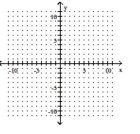
Determine the largest open intervals of the domain over which the function is increasing, decreasing, and constant.
-
(Multiple Choice)
4.8/5 (27)
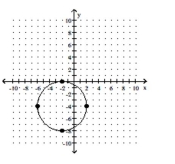
Use the graph to determine the equation of the circle in center-radius form.
-
(Multiple Choice)
4.7/5 (34)
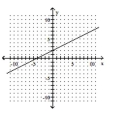
The graph of a linear function f is shown. Identify the slope, y-intercept, and x-intercept.
-
(Multiple Choice)
4.8/5 (37)
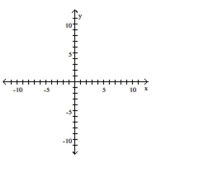
Graph the equation by determining the missing values needed to plot the ordered pairs.
-
(Multiple Choice)
4.8/5 (25)
The line graph shows the recorded hourly temperatures in degrees Fahrenheit at an airport. 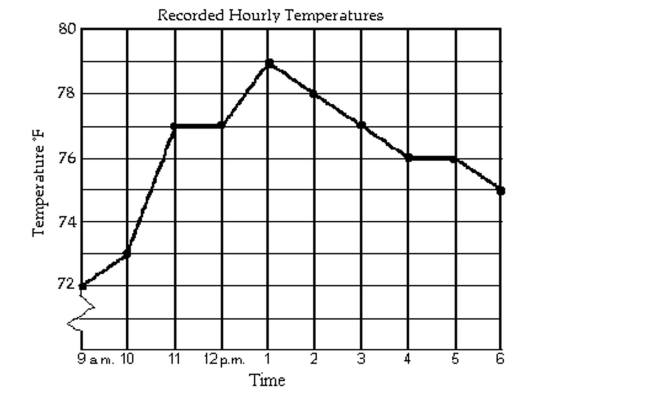 -What temperature was recorded at 5 p.m.?
(Multiple Choice)
4.8/5 (37)
The graph shows an idealized linear relationship for the average monthly payment to retirees from 1995 to 1999. Use the midpoint formula to estimate the average payment in 1997.
Average Monthly Payment to Retirees 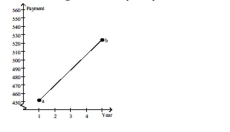 1995 1997 1999 a=\ 452;b=\ 524
(Multiple Choice)
4.8/5 (35)
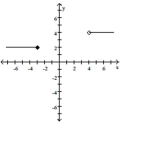
Give a rule for the piecewise-defined function. Then give the domain and range.
-
(Multiple Choice)
4.9/5 (33)
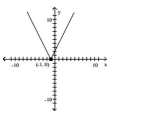
Use a graphing calculator to solve the linear equation.
-The graph of is shown in the standard viewing window. Which is the only choice that could possibly be the solution of the equation ?
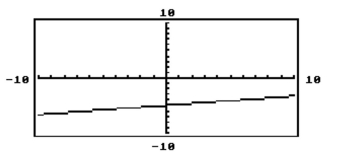
(Multiple Choice)
4.8/5 (32)
Graph the equation by determining the missing values needed to plot the ordered pairs.
-
(Multiple Choice)
4.9/5 (30)
Filters
- Essay(0)
- Multiple Choice(0)
- Short Answer(0)
- True False(0)
- Matching(0)