Exam 7: The Sampling Distribution of the Sample Mean
Exam 1: The Nature of Statistics88 Questions
Exam 2: Organizing Data169 Questions
Exam 3: Descriptive Measures195 Questions
Exam 4: Probability Concepts133 Questions
Exam 5: Discrete Random Variables163 Questions
Exam 6: The Normal Distribution144 Questions
Exam 7: The Sampling Distribution of the Sample Mean76 Questions
Exam 8: Confidence Intervals for One Population Mean84 Questions
Exam 9: Hypothesis Tests for One Population Mean58 Questions
Exam 10: Inferences for Two Population Means103 Questions
Exam 11: Inferences for Population Standard Deviations101 Questions
Exam 12: Inferences for Population Proportions104 Questions
Exam 13: Chi-Square Procedures74 Questions
Exam 14: Descriptive Methods in Regression and Correlation55 Questions
Exam 15: Inferential Methods in Regression and Correlation41 Questions
Exam 16: Analysis of Variance Anova71 Questions
Select questions type
Identify the distribution of the sample mean. In particular, state whether the distribution of is normal or approximately normal and give its mean and standard deviation.
-The mean annual income for adult women in one city is $28,520 and the standard deviation of the incomes is $5700. The distribution of incomes is skewed to the right. Determine the sampling
Distribution of the mean for samples of size 132.
(Multiple Choice)
4.7/5  (26)
(26)
Which of the following is not synonymous with the sampling distribution of the sample mean?
(Multiple Choice)
4.8/5 (40)
The ages of six members on a board of directors of a nonprofit organization are shown
below. Member A B C D E F Age 32 52 43 64 41 50
Consider these board members to be a population of interest. The table below shows all of the possible samples of size four. For each sample, the people in the sample, their ages, and the sample mean are listed. Use the table to find the mean of the variable .
Sample Ages A, B, C, D 32,52,43,64 47.75 A, B, C, E 32,52,43,41 42 A, B, C, F 32,52,43,50 44.25 A, B, D, E 32,52,64,41 47.25 A, B, D, F 32,52,64,50 49.5 A, B, E, F 32,52,41,50 43.75 A, C, D, E 32,43,64,41 45 A, C, D, F 32,43,64,50 47.25 A, C, E, F 32,43,41,50 41.5 A, D, E, F 32,64,41,50 46.75 B, C, D, E 52,43,64,41 50 B, C, D, F 52,43,64,50 52.25 B, C, E, F 52,43,41,50 46.5 B, D, E, F 52,64,41,50 51.75 C, D, E, F 43,64,41,50 49.5
(Short Answer)
5.0/5 (29)
Draw the specified dotplot.
-The heights (in inches)of 5 players on a basketball team are given in the table. Player A B C D E Height (inches) 65 78 72 68 57 \ Draw a dotplot for the sampling distribution of the sample mean for samples of size 4 . 
(Essay)
4.9/5 (30)
Provide an appropriate response.
-Consider the following two problems. (a)A random-number generator yields numbers in a uniform distribution between 0 and 1 with a mean of 0.5 and a standard deviation of 0.289. You wish to find the probability that the mean of a sample of 50 random numbers is greater than 0.6. (b)Scores on an aptitude test are normally distributed with a mean of 82 and a standard deviation of 11. You wish to find the probability that the score for a randomly selected person is greater than 90. Which of these two problems requires application of the Central Limit Theorem? Explain your reasoning.
(Essay)
4.9/5 (39)
The weights of five players on a football team are shown below. Player A B C D E Weight (lb) 290 310 250 255 220
Consider these players to be a population of interest. The mean weight, , for the population is 265 pounds. Construct a table that shows all of the possible samples of size four. For each of the possible samples, list the players in the sample, their weights, and the sample mean. The first line of the table is shown below. Sample Weights A, B, C, D 290,310,250,255 276.25
Use your table to find the probability that, for a random sample of size four, the sample mean will be within 10 lb of the population mean.
(Essay)
4.9/5 (44)
Identify the distribution of the sample mean. In particular, state whether the distribution of is normal or approximately normal and give its mean and standard deviation.
-For the population of one town, the number of siblings, , is a random variable whose relative frequency histogram has a reverse J-shape. The mean number of siblings is and the standard deviation is 1.3. Let denote the mean number of siblings for a random sample of size 39 .
Determine the sampling distribution of the mean for samples of size 39 .
(Multiple Choice)
4.9/5 (28)
Draw the specified dotplot.
-The heights (in inches)of 5 players on a basketball team are given in the table.
Player A B C D E Height (inches) 66 69 72 69 72 Draw a dotplot for the sampling distribution of the sample mean for samples of size 4 . 
(Essay)
4.7/5 (39)
Provide an appropriate response.
-What is the sampling distribution of a statistic?
(Multiple Choice)
4.7/5 (37)
Provide an appropriate response.
-The mean height for a population is 65 inches and the standard deviation is 3 inches. Let A and B
denote the events described below.
Event A: The mean height in a random sample of 16 people is within 1 inch of the population
mean.
Event B: The mean height in a random sample of 50 people is within 1 inch of the population mean.
The probability of event A is greater than the probability of event B?
(True/False)
4.8/5 (41)
Find the indicated probability or percentage for the sampling error.
-The monthly expenditures on food by single adults living in one neighborhood of Los Angeles are normally distributed with a mean of $370 and a standard deviation of $80. Determine the
Percentage of samples of size 4 that will have mean monthly expenditures on food within $72 of
The population mean expenditure of $370.
(Multiple Choice)
4.7/5 (28)
Provide an appropriate response.
-The typical computer random-number generator yields numbers in a uniform distribution between 0 and 1, with a mean of 0.500 and a standard deviation of 0.289. Consider the following two problems, which appear at a glance to be very similar. One can be solved using the Central Limit Theorem. Which one and why? (a)Suppose a sample of size 50 is randomly generated. Find the probability that the mean is below 0.300. (b)Suppose a sample of size 15 is randomly generated. Find the probability that the mean is below 0.300.
(Essay)
4.8/5 (29)
Find the requested probability.
-The test scores of 5 students are under consideration. The following is the dotplot for the sampling distribution of the sample mean for samples of size 2. 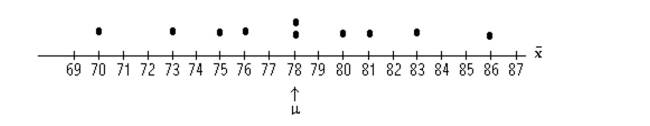 Find the probability, expressed as a percent, that the sample mean will be within 2 points of the
Population mean.
Find the probability, expressed as a percent, that the sample mean will be within 2 points of the
Population mean.
(Multiple Choice)
4.7/5 (28)
Find the requested probability.
-The table reports the distribution of pocket money, in bills, of the 6 students in a statistics seminar. Student Hannah Ming Keshaun Tameeka Jose Vaishali Amount, in dollars 2 4 4 5 5 7 For a random sample of size two, find the probability, expressed as a percent rounded to the nearest tenth, that the sample mean will be within $1 of the population mean.
(Multiple Choice)
4.8/5 (37)
Solve the problem.
-The weights of five players on a football team are shown below. Player A B C D E Weight (lb) 315 205 275 270 230
Consider these players to be a population of interest. The table below shows all of the possible samples of size two. For each sample, the players in the sample, their weights, and the sample mean are listed. Use the table to find the mean of the variable .
Sample Weights A, B 315,205 260 A, C 315,275 295 A, D 315,270 292.5 A, E 315,230 272.5 B, C 205,275 240 B, D 205,270 237.5 B, E 205,230 217.5 C, D 275,270 272.5 C, E 275,230 252.5 D, E 270,230 250
(Short Answer)
4.8/5 (42)
Let represent the number which shows up when a balanced die is rolled. Then is a random variable with a uniform distribution. Let denote the mean of the numbers obtained when the die is rolled 3 times. Which of the following statements concerning the sampling distribution of the mean, , is true?
(Multiple Choice)
4.9/5 (33)
Filters
- Essay(0)
- Multiple Choice(0)
- Short Answer(0)
- True False(0)
- Matching(0)