Exam 7: The Sampling Distribution of the Sample Mean
Exam 1: The Nature of Statistics88 Questions
Exam 2: Organizing Data169 Questions
Exam 3: Descriptive Measures195 Questions
Exam 4: Probability Concepts133 Questions
Exam 5: Discrete Random Variables163 Questions
Exam 6: The Normal Distribution144 Questions
Exam 7: The Sampling Distribution of the Sample Mean76 Questions
Exam 8: Confidence Intervals for One Population Mean84 Questions
Exam 9: Hypothesis Tests for One Population Mean58 Questions
Exam 10: Inferences for Two Population Means103 Questions
Exam 11: Inferences for Population Standard Deviations101 Questions
Exam 12: Inferences for Population Proportions104 Questions
Exam 13: Chi-Square Procedures74 Questions
Exam 14: Descriptive Methods in Regression and Correlation55 Questions
Exam 15: Inferential Methods in Regression and Correlation41 Questions
Exam 16: Analysis of Variance Anova71 Questions
Select questions type
For samples of the specified size from the population described, find the mean and standard deviation of the samplemean
-One barge from Inland Waterways, Inc. can carry a load of . Records of past trips show that the weights of the cans that it carries have a mean of and a standard deviation of . For samples of size 49 , find the mean and standard deviation of .
(Multiple Choice)
4.9/5  (25)
(25)
Find the requested probability.
-The test scores of 5 students are under consideration. The following is the dotplot for the sampling distribution of the sample mean for samples of size 2. 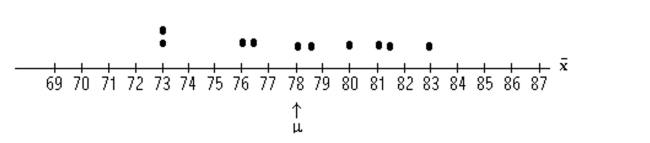 Find the probability, expressed as a percent, that the sample mean will be within 5 points of the
Population mean.
Find the probability, expressed as a percent, that the sample mean will be within 5 points of the
Population mean.
(Multiple Choice)
4.7/5 (37)
Solve the problem.
-The weights of five players on a football team are shown below. Player A B C D E Weight (lb) 290 310 250 255 220
Consider these players to be a population of interest. The table below shows all of the possible samples of size four. For each sample, the players in the sample, their weights, and the sample mean are listed. Use the table to find the mean of the variable .
Sample Weights A, B, C, D 290,310,250,255 276.25 A, B, C, E 290,310,250,220 267.5 A, B, D, E 290,310,255,220 268.75 A, C, D, E 290,250,255,220 253.75 B, C, D, E 310,250,255,220 258.75
(Short Answer)
4.9/5 (27)
Find the requested probability.
-The test scores of 5 students are under consideration. The following is the dotplot for the sampling distribution of the sample mean for samples of size 2. 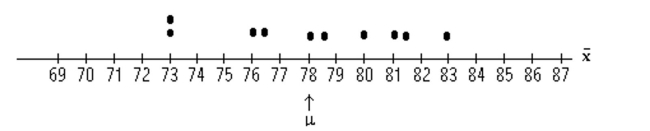 Find the probability, expressed as a percent, that the sample mean will be within 1 point of the
Population mean.
Find the probability, expressed as a percent, that the sample mean will be within 1 point of the
Population mean.
(Multiple Choice)
4.8/5 (39)
For samples of the specified size from the population described, find the mean and standard deviation of the samplemean
-One truck from Lakeland Trucking, Inc. can carry a load of . Records show that the weights of boxes that it carries have a mean of and a standard deviation of . For samples of size 64 , find the mean and standard deviation of .
(Multiple Choice)
4.9/5 (31)
Draw the specified dotplot.
-The heights (in inches)of 5 players on a basketball team are given in the table. Player A B C D E Height (inches) 66 69 72 69 72 Draw a dotplot for the sampling distribution of the sample mean for samples of size 2. 
(Essay)
4.7/5 (34)
Find the indicated probability or percentage for the sampling error.
-The monthly expenditures on food by single adults in one city are normally distributed with a mean of $410 and a standard deviation of $70. What is the probability that the sampling error made
In estimating the mean monthly expenditure of all single adults in that city by the mean of a
Random sample of 90 such adults will be at most $10?
(Multiple Choice)
5.0/5 (29)
Do you agree with Tony's reasoning below? Explain why you do or do not agree. Refer to the Central Limit Theorem in your explanation. Tony: "When a balanced die is rolled, each of the numbers 1, 2, 3, 4, 5, and 6 has an equal chance of showing up. So, if I roll the die 50 times and find the mean of the 50 numbers, the mean has the same chance of falling between 1 and 2 as it has of falling between 3 and 4."
(Essay)
4.9/5 (35)
Find the indicated probability or percentage for the sampling error.
-The amount of coffee that a filling machine puts into an 8-ounce jar is normally distributed with a mean of 8.2 ounces and a standard deviation of 0.18 ounce. What is the probability that the
Sampling error made in estimating the mean amount of coffee for all 8-ounce jars by the mean of a
Random sample of 100 jars will be at most 0.02 ounce?
(Multiple Choice)
4.9/5 (35)
Identify the distribution of the sample mean. In particular, state whether the distribution of is normal or approximatelynormal and give its mean and standard deviation.
-Let represent the number that shows up when a balanced die is rolled. Then is a random variable with a mean of and a standard deviation of 1.71. Let denote the mean of the numbers obtained when the die is rolled 40 times. Determine the sampling distribution of .
(Multiple Choice)
4.7/5 (29)
Solve the problem.
-The ages of six members on a board of directors of a nonprofit organization are shown
below. Member A B C D E F Age 29 49 47 29 63 32
Consider these board members to be a population of interest. The table below shows all of the possible samples of size five. For each sample, the people in the sample, their ages, and the sample mean are listed. Use the table to find the mean of the variable .
Sample Ages A, B, C, D, E 29,49,47,29,63 43.4 A, B, C, D, F 29,49,47,29,32 37.2 A, B, C, E, F 29,49,47,63,32 44 A, B, D, E, F 29,49,29,63,32 40.4 A, C, D, E, F 29,47,29,63,32 40 B, C, D, E, F 49,47,29,63,32 44
(Short Answer)
4.8/5 (29)
The heights of adult women in the U.S are normally distributed. Let denote the mean height for a random sample of 4 women. For samples of size 4 , which of the following statements concerning the sampling distribution of the mean is true?
(Multiple Choice)
4.9/5 (46)
Provide an appropriate response.
-Suppose that µ represents the mean height for a population of people. Suppose that you use a sample mean, to estimate µ. Explain what is meant by sampling error in this situation. Why does vary from one sample to the next? How can you reduce the likely sampling error?
(Essay)
4.8/5 (35)
Find the requested probability.
-The test scores of 5 students are under consideration. The following is the dotplot for the sampling distribution of the sample mean for samples of size 2.  Find the probability, expressed as a percent, that the sample mean will be within 3 points of the Population mean.
(Multiple Choice)
4.7/5 (37)
Identify the distribution of the sample mean. In particular, state whether the distribution of is normal or approximatelynormal and give its mean and standard deviation.
-The heights of people in a certain population are normally distributed with a mean of 65 inches and a standard deviation of 3.9 inches. Determine the sampling distribution of the mean for samples of Size 44.
(Multiple Choice)
4.9/5 (36)
Find the requested probability.
-The test scores of 5 students are under consideration. The following is the dotplot for the sampling distribution of the sample mean for samples of size 2. 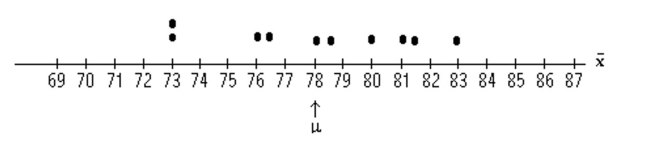 Find the probability, expressed as a percent, that the sample mean will be within 2 points of the Population mean.
(Multiple Choice)
4.9/5 (32)
Provide an appropriate response.
-How many different samples of size 2 can be obtained from a population of size 5?
(Multiple Choice)
4.7/5 (36)
Find the indicated probability or percentage for the sampling error.
-Scores on a biology final exam are normally distributed with a mean of 220 and a standard deviation of 24. Determine the percentage of samples of size 9 that will have mean scores within 12
Points of the population mean score of 220.
(Multiple Choice)
4.8/5 (34)
Find the requested probability.
-The table reports the GPA for each of five students in a statistics class. Student Maria Alvin Elvis Ingrid Rashad GPA 3.52 3.65 3.66 3.92 3.95 For a random sample of size two, find the probability, expressed as a percent, that the sample mean will be within 0.1 of the population mean.
(Multiple Choice)
4.8/5 (33)
Solve the problem.
-The weights of five players on a football team are shown below. Player A B C D E Weight (lb) 290 310 250 255 220
Consider these players to be a population of interest. The table below shows all of the possible samples of size three. For each sample, the players in the sample, their weights, and the sample mean are listed. Use the table to find the mean of the variable .
Sample Weights A, B, C 290,310,250 283. A, B, D 290,310,255 285 A, B, E 290,310220 273. A, C, D 290,250,255 265 A, C, E 290,250,220 253. A, D, E 290,255,220 255 B, C, D 310,250,255 271. B, C, E 310,250,220 260 B, D, E 310,255,220 261. C, D, E 250,255,220 241.
(Short Answer)
4.8/5 (40)
Filters
- Essay(0)
- Multiple Choice(0)
- Short Answer(0)
- True False(0)
- Matching(0)