Exam 7: The Sampling Distribution of the Sample Mean
Exam 1: The Nature of Statistics88 Questions
Exam 2: Organizing Data169 Questions
Exam 3: Descriptive Measures195 Questions
Exam 4: Probability Concepts133 Questions
Exam 5: Discrete Random Variables163 Questions
Exam 6: The Normal Distribution144 Questions
Exam 7: The Sampling Distribution of the Sample Mean76 Questions
Exam 8: Confidence Intervals for One Population Mean84 Questions
Exam 9: Hypothesis Tests for One Population Mean58 Questions
Exam 10: Inferences for Two Population Means103 Questions
Exam 11: Inferences for Population Standard Deviations101 Questions
Exam 12: Inferences for Population Proportions104 Questions
Exam 13: Chi-Square Procedures74 Questions
Exam 14: Descriptive Methods in Regression and Correlation55 Questions
Exam 15: Inferential Methods in Regression and Correlation41 Questions
Exam 16: Analysis of Variance Anova71 Questions
Select questions type
For samples of the specified size from the population described, find the mean and standard deviation of the samplemean
-The mean and the standard deviation of the sampled population are, respectively, 83.6 and 5.5.
(Multiple Choice)
4.9/5  (34)
(34)
The mean annual income for adult women in one city is and the standard deviation of the incomes is . The distribution of incomes is skewed to the right. For samples of size 30 , which of the following statements best describes the sampling distribution of the mean?
(Multiple Choice)
4.9/5 (45)
- Sample 4,5 4.5 4,6 5 4,7 5.5 4,8 6 5,6 5.5 5,7 6 5,8 6.5 6,7 6.5 6,8 7 7,8 7.5
(Multiple Choice)
4.8/5 (31)
For samples of the specified size from the population described, find the mean and standard deviation of the samplemean
-The National Weather Service keeps records of rainfall in valleys. Records indicate that in a certain valley, the annual rainfall has a mean of 95 inches and a standard deviation of 12 inches. Suppose the rainfalls are sampled during randomly picked years and is the mean amount of rain in these years. For samples of size 36 , determine the mean and standard deviation of .
(Multiple Choice)
4.9/5 (29)
Find the requested probability.
-The test scores of 5 students are under consideration. The following is the dotplot for the sampling distribution of the sample mean for samples of size 2. 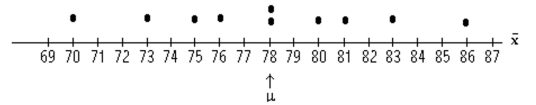 Find the probability, expressed as a percent, that the sample mean will be within 1 point of the population mean.
(Multiple Choice)
4.9/5 (30)
Provide an appropriate response.
-As a general rule, you cannot expect to exactly determine the sampling distribution of a statistic. Why?
(Multiple Choice)
4.8/5 (41)
Find the indicated probability or percentage for the sampling error.
-The monthly expenditures on food by single adults living in one neighborhood of Los Angeles are normally distributed with a mean of $410 and a standard deviation of $60. Determine the
Percentage of samples of size 9 that will have mean monthly expenditures on food within $16 of
The population mean expenditure of $410.
(Multiple Choice)
4.7/5 (39)
For the population of one town, the number of siblings is a random variable whose relative frequency histogram has a reverse J-shape. Let denote the mean number of siblings for a random sample of size 30. For samples of size 30, which of the following statements concerning the sampling distribution of the mean is true?
(Multiple Choice)
5.0/5 (35)
Find the indicated probability or percentage for the sampling error.
-The amount of coffee that a filling machine puts into an 8-ounce jar is normally distributed with a mean of 8.2 ounces and a standard deviation of 0.18 ounce. Determine the percentage of samples of
Size 16 that will have mean amounts of coffee within 0.1 ounce of the population mean of 8.2
Ounces.
(Multiple Choice)
4.8/5 (35)
Draw the specified dotplot.
-The heights (in inches)of 5 players on a basketball team are given in the table. Player A B C D E Height (inches) 65 78 72 68 57 Draw a dotplot for the sampling distribution of the sample mean for samples of size 2. 
(Essay)
4.8/5 (37)
The weights of five players on a football team are shown below.
Player A B C D E Weight (lb) 290 310 250 255 220
Consider these players to be a population of interest. The mean weight, , for the population is 265 pounds. Construct a table that shows all of the possible samples of size three. For each of the possible samples, list the players in the sample, their weights, and the sample mean. The first line of the table is shown below.
Sample Weights A, B, C 290,310,250 283.3
Use your table to find the probability that, for a random sample of size three, the sample mean will be within 15 lb of the population mean.
(Essay)
4.8/5 (46)
Let represent the number which shows up when a balanced die is rolled. Then is a random variable with a uniform distribution. Let denote the mean of the numbers obtained when the die is rolled 32 times. For samples of size 32, which of the following statements concerning the sampling distribution of the mean is true?
(Multiple Choice)
4.8/5 (39)
Draw the specified dotplot.
-The heights (in inches)of 5 players on a basketball team are given in the table. Player A B C D E Height (inches) 66 69 72 69 72 Draw a dotplot for the sampling distribution of the sample mean for samples of size 3. 
(Essay)
4.8/5 (40)
The mean height for a population of people is 65 inches. Suppose that you pick a sample of 50 people and determine the sample mean, . You then repeat this procedure three more times. You learned in class that . Can you conclude that the mean of the four sample means will be equal to the population mean of 65 inches? Why or why not?
(Essay)
4.9/5 (36)
The weights of five players on a football team are shown below. Player A B C D E Weight (lb) 290 310 250 255 220 Consider these players to be a population of interest. The mean weight, µ, for the population is 265 pounds. Construct a table that shows all of the possible samples of size two. For each of the possible samples, list the players in the sample, their weights, and the sample mean. The first line of the table is shown below. Sample Weights , 290,310 300 Use your table to find the probability that, for a random sample of size two, the sample mean will equal the population mean.
(Essay)
4.9/5 (34)
Provide an appropriate response.
-Population data: 4, 5, 8, 9. a. Find the mean, , of the variable. b. Use the population data below to construct a table giving the sample means of sample size . c. Draw a dotplot for the sampling distribution of the sample mean. d. Find the probability that the sample mean will equal the population mean. e. Find the probability that the sampling error made in estimating the population mean by the sampling mean will be or less (in magnitude), that is, that the absolute value of the difference between the sample mean and the population mean is at most .
(Essay)
4.7/5 (31)
For samples of the specified size from the population described, find the mean and standard deviation of the samplemean
-The mean and the standard deviation of the sampled population are, respectively, and
(Multiple Choice)
4.8/5 (31)
Provide an appropriate response.
-What generally happens to the sampling distribution of the sample mean as the sample size is decreased?
(Multiple Choice)
4.8/5 (36)
Find the indicated probability or percentage for the sampling error.
-The distribution of weekly salaries at a large company is right skewed with a mean of $1000 and a standard deviation of $350. What is the probability that the sampling error made in estimating the Mean weekly salary for all employees of the company by the mean of a random sample of weekly
Salaries of 50 employees will be at most $50?
(Multiple Choice)
4.8/5 (40)
Find the requested probability.
-The test scores of 5 students are under consideration. The following is the dotplot for the sampling distribution of the sample mean for samples of size 2. 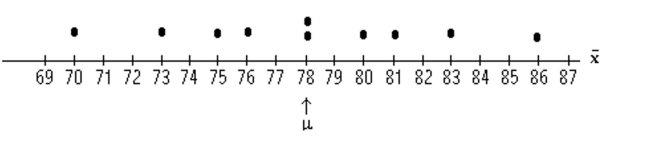 Find the probability, expressed as a percent, that the sample mean will be equal to the population Mean.
(Multiple Choice)
4.9/5 (32)
Filters
- Essay(0)
- Multiple Choice(0)
- Short Answer(0)
- True False(0)
- Matching(0)