Exam 13: Chi-Square Procedures
Exam 1: The Nature of Statistics88 Questions
Exam 2: Organizing Data169 Questions
Exam 3: Descriptive Measures195 Questions
Exam 4: Probability Concepts133 Questions
Exam 5: Discrete Random Variables163 Questions
Exam 6: The Normal Distribution144 Questions
Exam 7: The Sampling Distribution of the Sample Mean76 Questions
Exam 8: Confidence Intervals for One Population Mean84 Questions
Exam 9: Hypothesis Tests for One Population Mean58 Questions
Exam 10: Inferences for Two Population Means103 Questions
Exam 11: Inferences for Population Standard Deviations101 Questions
Exam 12: Inferences for Population Proportions104 Questions
Exam 13: Chi-Square Procedures74 Questions
Exam 14: Descriptive Methods in Regression and Correlation55 Questions
Exam 15: Inferential Methods in Regression and Correlation41 Questions
Exam 16: Analysis of Variance Anova71 Questions
Select questions type
Use the contingency table to solve the problem.
-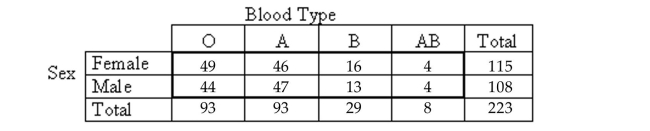 The contingency table above shows the blood types of a sample of people cross classified by sex. What percentage of people in the sample have blood type B?
(Multiple Choice)
4.9/5  (42)
(42)
The contingency table below shows political party affiliation cross classified by age group for a certain population. What information would be given by the marginal distribution of age group? How would you obtain this marginal distribution? What information would be given by the marginal distribution of political party affiliation? How would you obtain this marginal distribution? 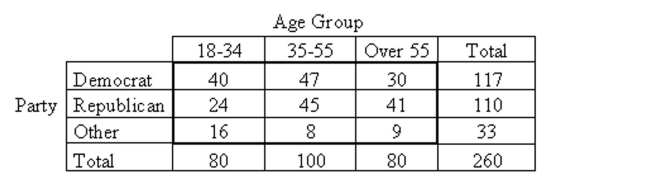
(Essay)
4.7/5 (39)
Perform the indicated goodness-of-fit test using the P-value method. Be sure to state the hypotheses and the significancelevel , to compute the value of the test statistic, to obtain the P-value, and to state your conclusion.
-A study conducted for New Woman magazine indicates that the number of children desired by newly-married American couples is distributed as follows. Number of children desired Percent 0 9\% 1 17\% 2 55\% 3 11\% Over 3 8\%
A random sample of 600 couples in California resulted in the following data. 0 55 1 118 2 340 3 60 Over 3 27 At the 1% significance level, does it appear that the "number of children desired" distribution of California couples is different from that of the American population as a whole?
(Essay)
4.8/5 (41)
Suppose that you wish to perform a chi-square test of independence. The two variables under consideration are sex and blood type. True or false, if the two variables are not associated, we would expect that in the sample, the number of women with a given blood type would be roughly equal to the number of men with the same blood type? If the statement is false, rewrite it so that it is true.
(Essay)
5.0/5 (42)
Perform a chi-square homogeneity test, provided the conditions for the test are met. Use the P-value approach.
-An independent simple random sample of 100 employees from 5 different companies was selected, and the number who take public transportation to work was recorded. The results are listed below, showing public transportation status and the five companies. At the 1% significance level, test the claim that employees of the five companies are nonhomogeneous with respect to public transportation status. Companies 1 2 3 4 5 Use Public Trans. 18 25 12 33 22 Don't Use Public Trans. 82 75 88 67 78
(Essay)
4.9/5 (41)
Perform the indicated goodness-of-fit test using the P-value method. Be sure to state the hypotheses and the significancelevel , to compute the value of the test statistic, to obtain the P-value, and to state your conclusion.
-A die is rolled 180 times and the following data are obtained. 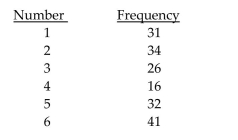 Do the data provide sufficient evidence to conclude that the die is loaded (i.e., that the six numbers are not equally likely)? Perform the hypothesis test at the 1% level of significance.
(Essay)
4.9/5 (37)
Perform the indicated goodness-of-fit test. Be sure to state the hypotheses and the significance level, to obtain the criticalvalue, to compute the value of the test statistic, and to state your conclusion.
-You roll a die 48 times with the following results. Number 1 2 3 4 5 6 Frequency 3 12 3 3 14 13 Do the data provide sufficient evidence to conclude that the die is loaded (i.e., that the six numbers are not equally likely)? Perform the hypothesis test at the 0.05 level of significance.
(Essay)
4.9/5 (37)
Perform the indicated goodness-of-fit test. Be sure to state the hypotheses and the significance level, to obtain the criticalvalue, to compute the value of the test statistic, and to state your conclusion.
-The U.S. Department of Defense provides data on the distribution of military personnel on active duty by branch of service. Below is a table giving the percentage distribution for 1985.
Branch of Service Percentage Army 36.3 Navy 26.5 Marine Corps 9.2 Air Force 28.0
A random sample of 325 military personnel currently on active duty gave the following statistics.
Branch of Service Frequency Army 118 Navy 92 Marine Corps 31 Air Force 84
At the 5% significance level, do the data provide evidence that the current distribution of military personnel on active duty differs from the 1985 distribution?
(Essay)
4.8/5 (36)
What assumptions are made when using a chi-square goodness-of-fit test?
(Essay)
4.9/5 (34)
Which of the following is not an assumption for performing a chi-square homogeneity test?
(Multiple Choice)
4.7/5 (39)
A -curve with 24 degrees of freedom resembles a normal curve more closely than a -curve with 23 degrees of freedom?
(True/False)
4.8/5 (37)
Use the contingency table to solve the problem.
-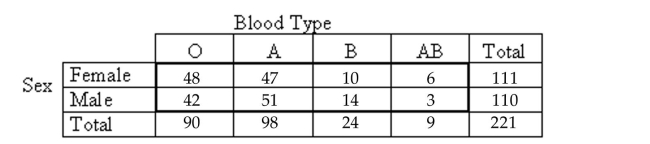 The contingency table above shows the blood types of a sample of patients cross classified by sex. How many of the men in the sample have blood type O?
(Multiple Choice)
4.8/5 (44)
-For a -curve with 7 degrees of freedom, find the -value having area to its right.
(Multiple Choice)
4.9/5 (46)
Suppose that you wish to perform a chi-square test of independence. True or false, if the two variables are not associated, then the test statistic has approximately a chi-square distribution with rc - 1 degrees of freedom, where and are the number of possible values for the two variables under consideration? If the statement is false, explain why.
(Essay)
4.9/5 (35)
Perform the indicated goodness-of-fit test using the P-value method. Be sure to state the hypotheses and the significancelevel , to compute the value of the test statistic, to obtain the P-value, and to state your conclusion.
-The U.S. Department of Defense provides data on the distribution of military personnel on active duty by branch of service. Below is a table giving the percentage distribution for 1985.
Branch of Service Percentage Army 36.3 Navy 26.5 Marine Corps 9.2 Air Force 28.0
A random sample of 325 military personnel currently on active duty gave the following statistics. Branch of Service Frequency Army 102 Navy 101 Marine Corps 40 Air Force 82
At the 5% significance level, do the data provide evidence that the current distribution of military personnel on active duty differs from the 1985 distribution?
(Essay)
4.7/5 (38)
Perform a chi-square independence test using the critical value approach, provided the conditions for using the test aremet. Be sure to state the hypotheses and the significance level, to obtain the expected frequencies, to obtain the criticalvalue, to compute the value of the test statistic, and to state your conclusion.
-Tests for adverse reactions to a new drug yielded the results given in the table. At the 0.05 significance level, do the data provide sufficient evidence to conclude that an association exists between the treatment (drug or placebo)and the reaction (whether or not headaches were experienced)? Drug Placebo Headaches 11 7 No headaches 73 91
(Essay)
4.9/5 (33)
When performing a chi-square goodness-of-fit test, how are the expected frequencies obtained?
(Essay)
4.9/5 (35)
The contingency table below shows political party affiliation cross classified by age group for a certain population. Obtain the conditional distribution of political party affiliation within each age group and the marginal distribution of political party affiliation. Is there association between the two variables? How can you tell? 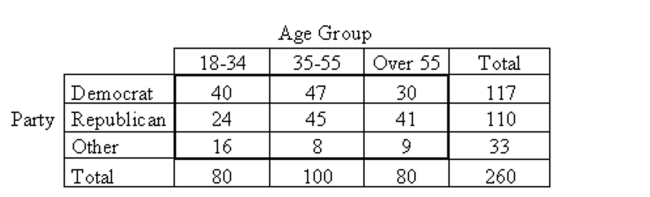
(Essay)
4.8/5 (37)
Filters
- Essay(0)
- Multiple Choice(0)
- Short Answer(0)
- True False(0)
- Matching(0)