Exam 13: Chi-Square Procedures
Exam 1: The Nature of Statistics88 Questions
Exam 2: Organizing Data169 Questions
Exam 3: Descriptive Measures195 Questions
Exam 4: Probability Concepts133 Questions
Exam 5: Discrete Random Variables163 Questions
Exam 6: The Normal Distribution144 Questions
Exam 7: The Sampling Distribution of the Sample Mean76 Questions
Exam 8: Confidence Intervals for One Population Mean84 Questions
Exam 9: Hypothesis Tests for One Population Mean58 Questions
Exam 10: Inferences for Two Population Means103 Questions
Exam 11: Inferences for Population Standard Deviations101 Questions
Exam 12: Inferences for Population Proportions104 Questions
Exam 13: Chi-Square Procedures74 Questions
Exam 14: Descriptive Methods in Regression and Correlation55 Questions
Exam 15: Inferential Methods in Regression and Correlation41 Questions
Exam 16: Analysis of Variance Anova71 Questions
Select questions type
Use the contingency table to solve the problem.
-The following contingency table shows the popular votes cast in the 1984 presidential election cross classified by region and political party. Data are in thousands, rounded to the nearest thousand. 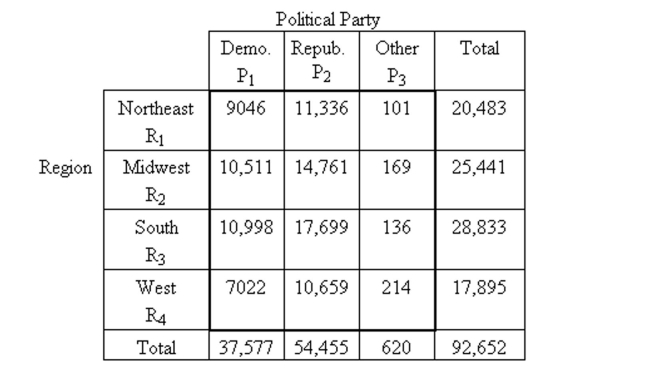 What percentage of those who voted Republican were in the South?
(Multiple Choice)
4.8/5  (35)
(35)
The table below shows the conditional distributions of the variable blood type for men and for women for a certain population. Is it possible to determine the marginal distribution of blood type? If so, what is it? Is it possible to determine the marginal distribution of sex? If so, what is it? 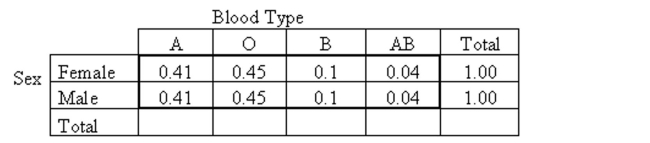
(Essay)
4.8/5 (38)
Perform a chi-square independence test using the critical value approach, provided the conditions for using the test aremet. Be sure to state the hypotheses and the significance level, to obtain the expected frequencies, to obtain the criticalvalue, to compute the value of the test statistic, and to state your conclusion.
-A researcher performed a study to determine whether an association exists between political party affiliation and income. She obtained the following sample data. 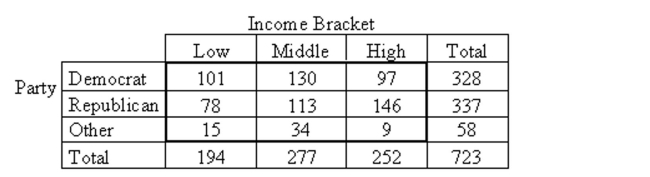 At the 10% significance level, do the data provide sufficient evidence to conclude that an association exists between political party affiliation and income?
(Essay)
4.8/5 (27)
Find the value of the chi-square test statistic for the goodness-of-fit test.
-You wish to test the claim that workplace accidents are distributed on workdays as follows: Monday: 25\%, Tuesday: , Wednesday: , Thursday: , Friday: . In a study of 100 workplace accidents, 24 occurred on a Monday, 15 occurred on a Tuesday, 13 occurred on a Wednesday, 14 occurred on a Thursday, and 34 occurred on a Friday. What is the value of the test statistic? The observed frequencies and the expected frequencies are shown below.
Observed Frequency () Expected Frequency (E) 24 25 15 15 13 15 14 15 34 30
(Multiple Choice)
4.9/5 (25)
Perform the indicated goodness-of-fit test using the P-value method. Be sure to state the hypotheses and the significancelevel , to compute the value of the test statistic, to obtain the P-value, and to state your conclusion.
-A firm that manufactures engines for racing boats gathers data from all of its plants. The table below gives the distribution of the life span of the engines (in numbers of months)for the entire firm. Relative Frequency 70-79 0.017 80-89 0.201 90-99 0.353 100-109 0.331 0.098 A random sample of 448 engines from the firm's Ohio plant gives the following results. Number of engine 70-79 22 80-89 131 90-99 46 100-109 154 At the 5% significance level, do the data provide evidence that the distribution of the life spans of the engines manufactured at the Ohio plant is different from the firm's overall distribution?
(Essay)
4.8/5 (48)
A researcher records for each of 500 randomly selected towns, the number of churches in the town and the number of homicides in the town in the past ten years. The towns range in size from a population of 1000 to a population of 1,000,000. He then performs a chi-square test of independence for these two variables. Would you expect that he would find association between the two variables? If so, should he conclude that a causal relationship exists? Explain your thinking.
(Essay)
4.9/5 (38)
Find the value of the chi-square test statistic for the goodness-of-fit test.
-A firm that manufactures engines for racing boats gathers data from all of its plants. The table below gives the distribution of the life span of the engines (in number of months)for the entire
Firm.
Months Relative frequency Under 60 0.078 70-79 0.205 80-89 0.491 90-99 0.151 100-109 0.075
A random sample of 591 engines from the firm's Ohio plant gives the following results.
Months Number of Engines Under 60 105 70-79 26 80-89 152 90-99 182 100-109 126
You wish to test the claim that the distribution of the life spans of the engines manufactured at the Ohio plant is the same as the firm's overall distribution. What is the value of the test statistic?
(Multiple Choice)
4.7/5 (35)
Perform a chi-square independence test using the critical value approach, provided the conditions for using the test aremet. Be sure to state the hypotheses and the significance level, to obtain the expected frequencies, to obtain the criticalvalue, to compute the value of the test statistic, and to state your conclusion.
-160 students who were majoring in either math or English were asked a test question, and the researcher recorded whether they answered the question correctly. The sample results are given below. At the 0.10 significance level, do the data provide sufficient evidence to conclude that an association exists between response and major? Correct Incorrect Math 27 53 English 43 37
(Essay)
4.7/5 (42)
Perform a chi-square independence test using the critical value approach, provided the conditions for using the test aremet. Be sure to state the hypotheses and the significance level, to obtain the expected frequencies, to obtain the criticalvalue, to compute the value of the test statistic, and to state your conclusion.
-At the 0.01 significance level, do the data provide sufficient evidence to conclude that an association exists between car color and the likelihood of being in an accident? Red Blue White Car has been in accident 28 33 36 Car has not been in accident 23 22 30
(Essay)
4.8/5 (41)
Use the contingency table to solve the problem.
-The following contingency table shows the popular votes cast in the 1984 presidential election cross classified by region and political party. Data are in thousands, rounded to the nearest thousand. 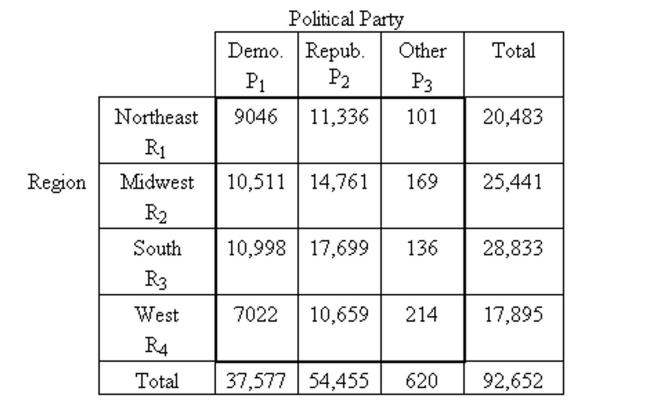 What percentage of the voters were in the Midwest?
(Multiple Choice)
4.8/5 (38)
Perform a chi-square independence test using the critical value approach, provided the conditions for using the test aremet. Be sure to state the hypotheses and the significance level, to obtain the expected frequencies, to obtain the criticalvalue, to compute the value of the test statistic, and to state your conclusion.
-The table below shows the age and favorite type of music of 668 randomly selected people.
Rock Jazz Classical 15-25 50 85 73 25-35 68 91 60 35-45 90 74 77
At the 0.05 significance level, do the data provide sufficient evidence to conclude that an association exists between age and preferred music type?
(Essay)
4.9/5 (48)
Perform a chi-square independence test using the critical value approach, provided the conditions for using the test aremet. Be sure to state the hypotheses and the significance level, to obtain the expected frequencies, to obtain the criticalvalue, to compute the value of the test statistic, and to state your conclusion.
-Research is conducted regarding the average age at retirement for four career groups. To test whether there is a relationship between age of retirement and career in these groups, 700 employees, recently retired, are randomly selected. The resulting data are displayed in the contingency table below. 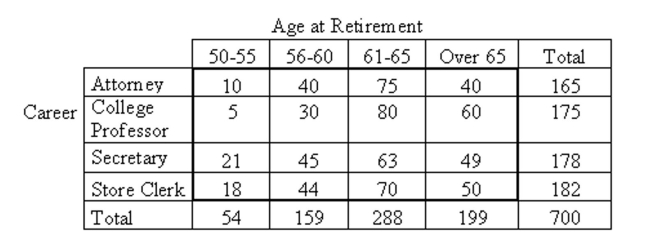 At the 5% significance level, do the data provide sufficient evidence to conclude that an association exists between age of retirement and career?
(Essay)
4.9/5 (40)
What is a chi-square goodness-of-fit test used for? For what kinds of variable can it be used?
(Essay)
4.8/5 (45)
Perform a chi-square independence test using the P-value approach, provided the conditions for using the test are met.Be sure to state the hypotheses and the significance level, to obtain the expected frequencies, to compute the value of thetest statistic, to obtain the P-value, and to state your conclusion.
-A researcher performed a study to determine whether an association exists between sex and blood type. He obtained the following sample data. 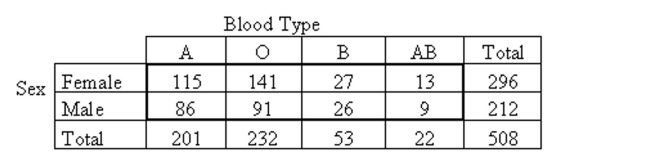 At the 10% significance level, do the data provide sufficient evidence to conclude that an association exists between sex and blood type?
(Essay)
4.8/5 (41)
What is the null hypothesis for the chi-square test of independence? What assumptions are required for this test?
(Essay)
4.9/5 (44)
Use the contingency table to solve the problem.
-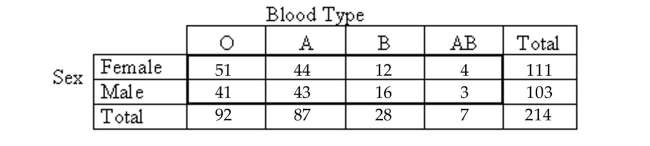 The contingency table above shows the blood types of a sample of patients cross classified by sex. How many people in the sample have blood type B?
(Multiple Choice)
4.8/5 (41)
Perform a chi-square independence test using the P-value approach, provided the conditions for using the test are met.Be sure to state the hypotheses and the significance level, to obtain the expected frequencies, to compute the value of thetest statistic, to obtain the P-value, and to state your conclusion.
-Research is conducted regarding the average age at retirement for four career groups. To test whether there is a relationship between age of retirement and career in these groups, 700 employees, recently retired, are randomly selected. The resulting data are displayed in the contingency table below. 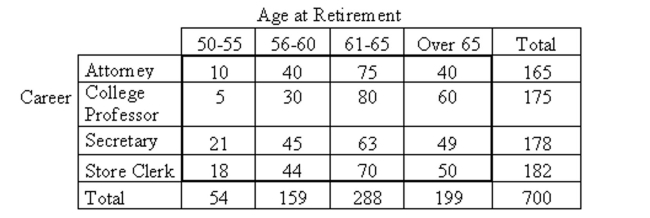 At the 5% significance level, do the data provide sufficient evidence to conclude that an association exists between age of retirement and career?
(Essay)
4.9/5 (30)
The table below shows the conditional distributions of the variable blood type for men and for women for a certain population. Is there association between the two variables blood type and sex? How can you tell? 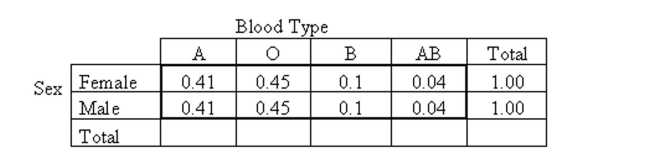
(Essay)
4.9/5 (29)
Filters
- Essay(0)
- Multiple Choice(0)
- Short Answer(0)
- True False(0)
- Matching(0)