Exam 13: Chi-Square Procedures
Exam 1: The Nature of Statistics88 Questions
Exam 2: Organizing Data169 Questions
Exam 3: Descriptive Measures195 Questions
Exam 4: Probability Concepts133 Questions
Exam 5: Discrete Random Variables163 Questions
Exam 6: The Normal Distribution144 Questions
Exam 7: The Sampling Distribution of the Sample Mean76 Questions
Exam 8: Confidence Intervals for One Population Mean84 Questions
Exam 9: Hypothesis Tests for One Population Mean58 Questions
Exam 10: Inferences for Two Population Means103 Questions
Exam 11: Inferences for Population Standard Deviations101 Questions
Exam 12: Inferences for Population Proportions104 Questions
Exam 13: Chi-Square Procedures74 Questions
Exam 14: Descriptive Methods in Regression and Correlation55 Questions
Exam 15: Inferential Methods in Regression and Correlation41 Questions
Exam 16: Analysis of Variance Anova71 Questions
Select questions type
A chi-square goodness-of-fit test is to be performed. The relative frequencies for the null
hypothesis and the sample size are given. True or false, the assumptions for using a chi-square
goodness-of-fit test are satisfied? Sample size:
Relative frequencies:
(True/False)
4.7/5  (36)
(36)
The contingency table below shows political party affiliation cross classified by age group for a certain population. What information would be given by the conditional distribution of age group for Democrats? How would you obtain this conditional distribution? 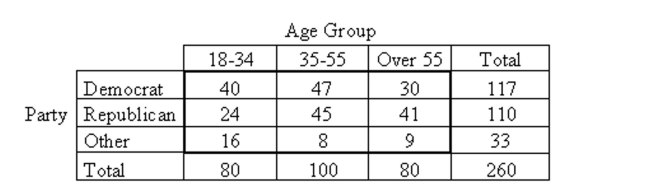
(Essay)
4.7/5 (29)
You have been using the chi-square test of independence to test for association between
two variables. Give an example of a pair of variables for which you would expect to find
no association. Give an example of a pair of variables for which you would expect to find
association, but not a causal relationship. Finally, give an example of a pair of variables for
which you would expect to find a causal relationship.
(Essay)
4.7/5 (42)
Perform the indicated goodness-of-fit test. Be sure to state the hypotheses and the significance level, to obtain the criticalvalue, to compute the value of the test statistic, and to state your conclusion.
-In studying the responses to a multiple-choice test question, the following sample data were obtained. At the 0.05 significance level, test the claim that all five responses occur with the same frequency. Response A B C D E Frequency 12 15 16 18 19
(Essay)
4.9/5 (34)
Suppose that you have a contingency table showing political party affiliation cross classified by age group for a certain population. Explain how you can determine whether there is an association between age group and political party affiliation.
(Essay)
4.8/5 (48)
Find the specified conditional or marginal distribution for the given contingency table. Round to the nearest tenth of apercent if needed.
-During a poll, 129 people were randomly selected and asked their political party affiliation. The contingency table below shows the results cross classified by political party affiliation and sex. 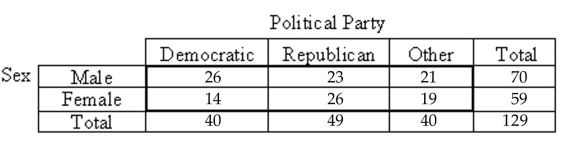 Find the marginal distribution of political party affiliation.
(Multiple Choice)
4.7/5 (35)
Find the specified conditional or marginal distribution for the given contingency table. Round to the nearest tenth of apercent if needed.
-Use the given contingency table to find the marginal distribution of the variable "income bracket". 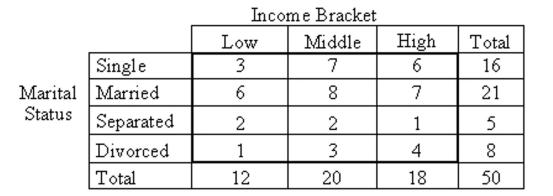
(Multiple Choice)
4.8/5 (48)
Perform a chi-square independence test using the critical value approach, provided the conditions for using the test aremet. Be sure to state the hypotheses and the significance level, to obtain the expected frequencies, to obtain the criticalvalue, to compute the value of the test statistic, and to state your conclusion.
-A car insurance company performed a study to determine whether an association exists between age and the frequency of car accidents. They obtained the following sample data. 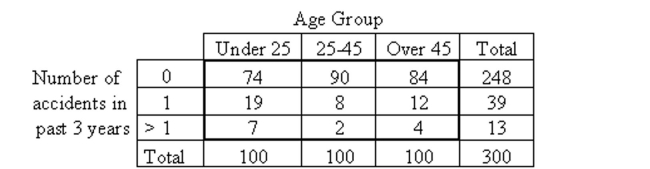 At the 1% significance level, do the data provide sufficient evidence to conclude that an association exists between age and frequency of car accidents?
(Essay)
4.9/5 (42)
Find the required value.
-For a -curve with 18 degrees of freedom, find the -value having area to its right.
(Multiple Choice)
4.7/5 (43)
Explain why a chi-square goodness-of-fit test is always right-tailed.
(Essay)
4.9/5 (35)
Perform a chi-square homogeneity test, provided the conditions for the test are met. Use the critical-value approach.
-A researcher wishes to test whether the proportion of college students who smoke is the same in four different colleges. She uses independent simple random samples to select 100 students from each college and records the number that smoke. The results are shown below, showing smoking status and college. College A College B College C College D Smoke 17 26 11 34 Don't smoke 83 74 89 66 Use a 1% significance level to test the claim that the distribution of smoking status is different at the four colleges.
(Essay)
4.8/5 (32)
Find the specified conditional or marginal distribution for the given contingency table. Round to the nearest tenth of apercent if needed.
-The contingency table below shows the income level for a random sample of adults cross classified by sex. 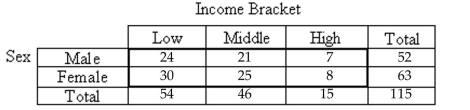 Find the marginal distribution of the variable "income bracket".
(Multiple Choice)
4.9/5 (41)
Perform a chi-square independence test using the P-value approach, provided the conditions for using the test are met.Be sure to state the hypotheses and the significance level, to obtain the expected frequencies, to compute the value of thetest statistic, to obtain the P-value, and to state your conclusion.
-A researcher performed a study to determine whether an association exists between political party affiliation and income. She obtained the following sample data. 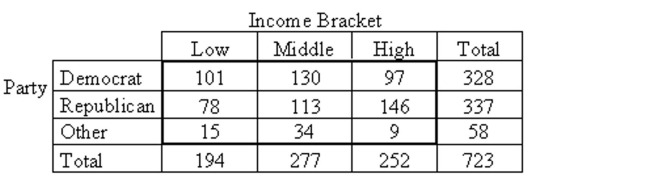 At the 1% significance level, do the data provide sufficient evidence to conclude that an association exists between political party affiliation and income?
(Essay)
4.8/5 (33)
In the chi-square test of independence, the test statistic used is . Discuss the meaning of and and explain the circumstances under which the values will be smaller or larger. What is the relationship between a significant value and the values of and ?
(Essay)
4.8/5 (35)
Filters
- Essay(0)
- Multiple Choice(0)
- Short Answer(0)
- True False(0)
- Matching(0)