Exam 9: Inferences Based on Two Samples: Confidence Intervals and Tests of Hypotheses
Exam 1: Statistics, Data, and Statistical Thinking77 Questions
Exam 2: Methods for Describing Sets of Data187 Questions
Exam 3: Probability284 Questions
Exam 4: Discrete Random Variables134 Questions
Exam 5: Continuous Random Variables138 Questions
Exam 6: Sampling Distributions52 Questions
Exam 7: Inferences Based on a Single Sample: Estimation With Confidence Intervals125 Questions
Exam 8: Inferences Based on a Single144 Questions
Exam 9: Inferences Based on Two Samples: Confidence Intervals and Tests of Hypotheses100 Questions
Exam 10: Analysis of Variance: Comparing More Than Two Means91 Questions
Exam 11: Simple Linear Regression113 Questions
Exam 12: Multiple Regression and Model Building131 Questions
Exam 13: Categorical Data Analysis60 Questions
Exam 14: Nonparametric Statistics Available Online87 Questions
Select questions type
An experiment has been conducted at a university to compare the mean number of study
hours expended per week by student athletes with the mean number of hours expended
by non athletes. A random sample of 55 athletes produced a mean equal to 20.6 hours
studied per week and a standard deviation equal to 5.5 hours. A second random sample of
200 non athletes produced a mean equal to 23.5 hours per week and a standard deviation
equal to 4 hours. How many students would need to be sampled in order to estimate the
difference in means to within 1.5 hours with probability 95%?
(Essay)
4.8/5  (29)
(29)
Consider the following set of salary data: Men (1) Women (2) Sample Size 100 80 Mean \ 12,850 \ 13,000 Standard Deviation \ 345 \ 500
Suppose the test statistic turned out to be (not the correct value). Find a two-tailed -value for this test statistic.
(Multiple Choice)
4.7/5 (25)
A confidence interval for is . Which of the following inferences is correct?
(Multiple Choice)
4.8/5 (45)
The screen below shows the confidence interval for .
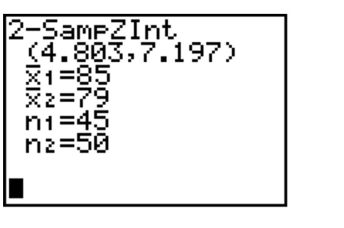 What does the interval suggest about the relationship between and ?
(Essay)
4.8/5 (37)
Suppose it desired to compare two physical education training programs for
preadolescent girls. A total of 242 girls are randomly selected, with 121 assigned to each
program. After three 6-week periods on the program, each girl is given a fitness test that
yields a score between 0 and 100. The means and variances of the scores for the two
groups are shown in the table. n Program 1 121 78.3 201.8 Program 2 121 75.5 259.1 Test to determine if the variances of the two programs differ. Use \alpha=.05 .
(Essay)
4.9/5 (38)
A marketing study was conducted to compare the variation in the age of male and female purchasers of a certain product. Random and independent samples were selected for both male
And female purchasers of the product. The sample data is shown here:  Identify the rejection region to that should be used to determine if the variation in the female ages exceeds the variation in the male ages when testing at .
(Multiple Choice)
4.9/5 (39)
Consider the following set of salary data: Men (1) Women (2) Sample Size 100 80 Mean \ 12,850 \ 13,000 Standard Deviation \ 345 \ 500 What assumptions are necessary to perform a test for the difference in population means?
(Multiple Choice)
4.8/5 (39)
A paired difference experiment has 75 pairs of observations. What is the rejection region for testing ? Use .
(Essay)
4.8/5 (36)
Data was collected from CEOs of companies within both the low-tech industry and the consumer products industry. The following printout compares the mean return-to-pay ratios between CEOs
In the low tech industry with CEOs in the consumer products industry. HYPOTHESIS: MEAN X = MEAN Y
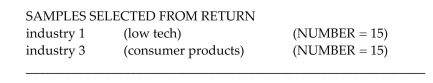
 If we conclude that the mean return-to-pay ratios of the consumer products and low tech CEOs are equal when, in fact, a difference really does exist between the means, we would be making a
(Multiple Choice)
4.8/5 (44)
Calculate the degrees of freedom associated with a small-sample test of hypothesis for , assuming and .
(Multiple Choice)
4.8/5 (32)
A paired difference experiment produced the following results.
Perform the appropriate test to determine whether there is sufficient evidence to conclude that using .
(Essay)
4.8/5 (40)
Which supermarket has the lowest prices in town? All claim to be cheaper, but an independent agency recently was asked to investigate this question. The agency randomly selected 100 items
Common to each of two supermarkets (labeled A and B)and recorded the prices charged by each
Supermarket. The summary results are provided below:
=2.09 =1.99 =.10 =0.22 =0.19 =.03
Assuming a matched pairs design, which of the following assumptions is necessary for a confidence interval for the mean difference to be valid?
(Multiple Choice)
4.8/5 (38)
A consumer protection agency is comparing the work of two electrical contractors. The agency plans to inspect residences in which each of these contractors has done the wiring in order to
Estimate the difference in the proportions of residences that are electrically deficient. Suppose the
Proportions of residences with deficient work are expected to be about .7 for both contractors.
How many homes should be sampled in order to estimate the difference in proportions using a
95% confidence interval of width .3?
(Multiple Choice)
4.7/5 (37)
The FDA is comparing the mean caffeine contents of two brands of cola. Independent random samples of 6-oz. cans of each brand were selected and the caffeine content of each can determined.
The study provided the following summary information. Brand A Brand B Sample size 15 10 Mean 18 20 Variance 1.2 1.5
How many cans of each soda would need to be sampled in order to estimate the difference in the mean caffeine content to within .5 with reliability?
(Multiple Choice)
4.8/5 (36)
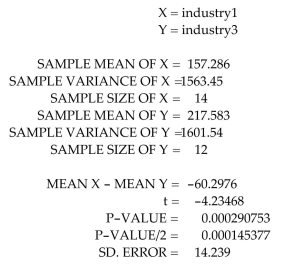
A cola manufacturer invited consumers to take a blind taste test. Consumers were asked to decide which of two sodas they preferred. The manufacturer was also interested in what factors played a
Role in taste preferences. Below is a printout comparing the taste preferences of men and women. HYPOTHESIS: PROP. PROP. Y
SAMPLES SELECTED FROM soda(brand1,brand2)
 Suppose the manufacturer wanted to test to determine if the males preferred its brand more than the females. Using the test statistic given, compute the appropriate -value for the test.
(Multiple Choice)
4.9/5 (39)
A paired difference experiment yielded pairs of observations. For the given case, what is the rejection region for testing against Ha: ?
(Multiple Choice)
4.9/5 (33)
Independent random samples selected from two normal populations produced the
following sample means and standard deviations. Sample 1 Sample 2 =14 =11 =7.1 =8.4 =2.3 =2.9
Find and interpret the confidence interval for .
(Essay)
4.9/5 (37)
Using paired differences removes sources of variation that tend to inflate
(True/False)
4.9/5 (34)
Filters
- Essay(0)
- Multiple Choice(0)
- Short Answer(0)
- True False(0)
- Matching(0)