Exam 9: Inferences Based on Two Samples: Confidence Intervals and Tests of Hypotheses
Exam 1: Statistics, Data, and Statistical Thinking77 Questions
Exam 2: Methods for Describing Sets of Data187 Questions
Exam 3: Probability284 Questions
Exam 4: Discrete Random Variables134 Questions
Exam 5: Continuous Random Variables138 Questions
Exam 6: Sampling Distributions52 Questions
Exam 7: Inferences Based on a Single Sample: Estimation With Confidence Intervals125 Questions
Exam 8: Inferences Based on a Single144 Questions
Exam 9: Inferences Based on Two Samples: Confidence Intervals and Tests of Hypotheses100 Questions
Exam 10: Analysis of Variance: Comparing More Than Two Means91 Questions
Exam 11: Simple Linear Regression113 Questions
Exam 12: Multiple Regression and Model Building131 Questions
Exam 13: Categorical Data Analysis60 Questions
Exam 14: Nonparametric Statistics Available Online87 Questions
Select questions type
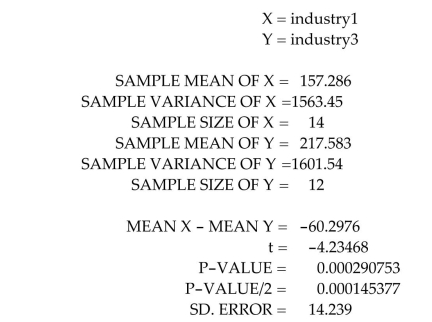
Salary data were collected from CEOs in the consumer products industry and CEOs in the telecommunication industry. The data were analyzed using a software package in order to
Compare mean salaries of CEOs in the two industries. HYPOTHESIS: MEAN X = MEAN Y
SAMPLES SELECTED FROM SALARY
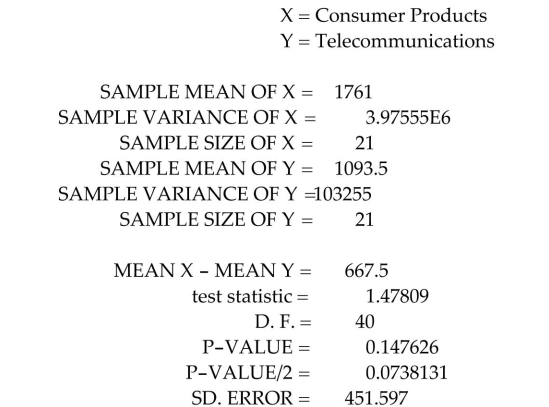 What of the following assumptions is necessary to perform the test described above?
(Multiple Choice)
4.8/5  (41)
(41)
A researcher is investigating which of two newly developed automobile engine oils is better at prolonging the life of an engine. Since there are a variety of automobile engines, 20 different engine
Types were randomly selected and were tested using each of the two engine oils. The number of
Hours of continuous use before engine breakdown was recorded for each engine oil. Based on the
Information provided, what type of analysis will yield the most useful information?
(Multiple Choice)
4.8/5 (24)
The screens below show the results of a test of against
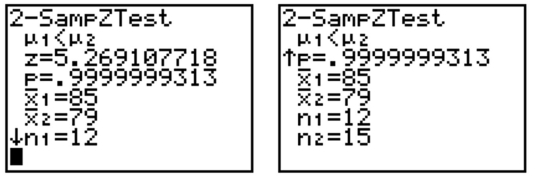 Comment on the validity of the results.
(Essay)
5.0/5 (44)
In order to compare the means of two populations, independent random samples of 225
observations are selected from each population with the following results. Sample 1 Sample 2 =478 =481 =14.2 =11.2
Test the null hypothesis against the alternative hypothesis using . Give the significance level, and interpret the result.
(Essay)
4.7/5 (28)
The owners of an industrial plant want to determine which of two types of fuel (gas or electricity) will produce more useful energy at a lower cost. The cost is measured by plant investment per
Delivered quad ($ invested /quadrillion BTUs). The smaller this number, the less the industrial
Plant pays for delivered energy. Suppose we wish to determine if there is a difference in the
Average investment/quad between using electricity and using gas. Our null and alternative
Hypotheses would be:
(Multiple Choice)
4.8/5 (36)
University administrators are trying to decide where to build a new parking garage on campus. The state legislature has budgeted just enough money for one parking structure on campus. The administrators have determined that the parking garage will be built either by the college of engineering or by the college of business. To help make the final decision, the university has randomly and independently asked students from each of the two colleges to estimate how long they usually take to find a parking spot on campus (in minutes). Based on their sample, the following confidence interval (for ) was created . What conclusion can the university make about the population mean parking times based on this confidence interval?
(Multiple Choice)
4.8/5 (35)
An inventor has developed a new spray coating that is designed to improve the wear of bicycle tires. To test the new coating, the inventor randomly selects one of the two tires on each of 50
Bicycles to be coated with the new spray. The bicycle is then driven for 100 miles and the amount
Of the depth of the tread left on the two bicycle tires is measured (in millimeters). It is desired to
Determine whether the new spray coating improves the wear of the bicycle tires. The data and
Summary information is shown below: Bicycle Coated Tire (C) Non-Coated Tire (N) 1 1.452 0.785 2 1.634 0.844 + 1 + 50 1.211 0.954
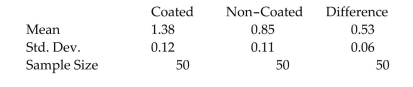 Use the summary data to calculate the test statistic to determine if the new spray coating improves the mean wear of the bicycle tires.
(Multiple Choice)
4.9/5 (32)
A new weight-reducing technique, consisting of a liquid protein diet, is currently undergoing tests by the Food and Drug Administration (FDA) before its introduction into the market. The weights of a random sample of five people are recorded before they are introduced to the liquid protein diet. The five individuals are then instructed to follow the liquid protein diet for 3 weeks. At the end of this period, their weights (in pounds) are again recorded. The results are listed in the table. Let be the true mean weight of individuals before starting the diet and let be the true mean weight of individuals after 3 weeks on the diet.
Person Weight Before Diet Weight After Diet
1 146 139 2 191 186 3 184 181 4 193 187 5 200 196
Summary information is as follows: .
Test to determine if the diet is effective at reducing weight. Use .
(Essay)
4.8/5 (39)
Two surgical procedures are widely used to treat a certain type of cancer. To compare the
success rates of the two procedures, random samples of surgical patients were obtained
and the numbers of patients who showed no recurrence of the disease after a 1-year
period were recorded. The data are shown in the table. n Number of Successes Procedure A 100 78 Procedure B 100 92 How large a sample would be necessary in order to estimate the difference in the true
success rates to within .10 with 95% reliability?
(Essay)
4.8/5 (39)
Calculate the degrees of freedom associated with a small-sample test of hypothesis for , assuming and .
(Multiple Choice)
4.8/5 (36)
Which of the following represents the difference in two population proportions?
(Multiple Choice)
4.9/5 (39)
A confidence interval for is . Which of the following inferences is correct?
(Multiple Choice)
4.8/5 (30)
Data was collected from CEOs of companies within both the low-tech industry and the consumer products industry. The following printout compares the mean return-to-pay ratios between CEOs
In the low-tech industry with CEOs in the consumer products industry. HYPOTHESIS: MEAN X = MEAN Y
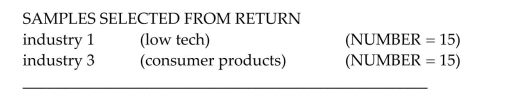
 Using the printout, which of the following assumptions is not necessary for the test to be valid?
(Multiple Choice)
4.7/5 (38)
The data for a random sample of five paired observations are shown below. 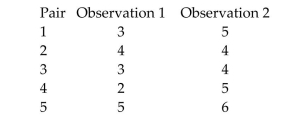 a. Calculate the difference between each pair of observations by subtracting observation 2 from observation 1. Use the differences to calculate and .
b. Calculate the means and of each column of observations. Show that .
c. Form a confidence interval for .
a. Calculate the difference between each pair of observations by subtracting observation 2 from observation 1. Use the differences to calculate and .
b. Calculate the means and of each column of observations. Show that .
c. Form a confidence interval for .
(Essay)
4.8/5 (35)
Which of the following represents the difference in two population means?
(Multiple Choice)
4.8/5 (38)
A paired difference experiment yielded pairs of observations. For the given case, what is the rejection region for testing against Ha: ?
(Multiple Choice)
4.8/5 (43)
Filters
- Essay(0)
- Multiple Choice(0)
- Short Answer(0)
- True False(0)
- Matching(0)