Exam 9: Inferences Based on Two Samples: Confidence Intervals and Tests of Hypotheses
Exam 1: Statistics, Data, and Statistical Thinking77 Questions
Exam 2: Methods for Describing Sets of Data187 Questions
Exam 3: Probability284 Questions
Exam 4: Discrete Random Variables134 Questions
Exam 5: Continuous Random Variables138 Questions
Exam 6: Sampling Distributions52 Questions
Exam 7: Inferences Based on a Single Sample: Estimation With Confidence Intervals125 Questions
Exam 8: Inferences Based on a Single144 Questions
Exam 9: Inferences Based on Two Samples: Confidence Intervals and Tests of Hypotheses100 Questions
Exam 10: Analysis of Variance: Comparing More Than Two Means91 Questions
Exam 11: Simple Linear Regression113 Questions
Exam 12: Multiple Regression and Model Building131 Questions
Exam 13: Categorical Data Analysis60 Questions
Exam 14: Nonparametric Statistics Available Online87 Questions
Select questions type
A paired difference experiment yielded pairs of observations. For the given case, what is the rejection region for testing against ?
(Multiple Choice)
4.8/5  (36)
(36)
Calculate the degrees of freedom associated with a small-sample test of hypothesis for , assuming and .
(Multiple Choice)
4.8/5 (37)
Independent random samples from normal populations produced the results shown
below. Sample 1:
Sample 2: 4.4, 6.1, 5.2,
a. Calculate the pooled estimator of .
b. Test using .
c. Find a confidence interval for .
(Essay)
5.0/5 (40)
A paired difference experiment has 15 pairs of observations. What is the rejection region for testing ? Use .
(Essay)
4.9/5 (36)
Suppose you want to estimate the difference between two population proportions correct to within 0.03 with probability 0.90. If prior information suggests that p1 ≈ 0.4 and p2 ≈ 0.8, and you want to
Select independent random samples of equal size from the populations, how large should the
Sample sizes be?
(Multiple Choice)
5.0/5 (38)
When blood levels are low at an area hospital, a call goes out to local residents to give blood. The blood center is interested in determining which sex - males or females - is more likely to respond.
Random, independent samples of 60 females and 100 males were each asked if they would be
Willing to give blood when called by a local hospital. A success is defined as a person who
Responds to the call and donates blood. The goal is to compare the percentage of the successes
Between the male and female responses. What type of analysis should be used?
(Multiple Choice)
4.8/5 (34)
In a controlled laboratory environment, a random sample of 10 adults and a random sample of 10 children were tested by a psychologist to determine the room temperature that each person finds
Most comfortable. The data are summarized below: Sample Mean Sample Variance Adults (1) 77. 4.5 Children (2) 74. 2.5
If the psychologist wished to test the hypothesis that children prefer warmer room temperatures than adults, which set of hypotheses would he use?
(Multiple Choice)
5.0/5 (39)
The data for a random sample of six paired observations are shown below. 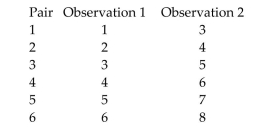 a. Calculate the difference between each pair of observations by subtracting observation 2 from observation 1. Use the differences to calculate .
b. Calculate the standard deviations and of each column of observations. Then find pooled estimate of the variance .
c. Comparing and , explain the benefit of a paired difference experiment.
a. Calculate the difference between each pair of observations by subtracting observation 2 from observation 1. Use the differences to calculate .
b. Calculate the standard deviations and of each column of observations. Then find pooled estimate of the variance .
c. Comparing and , explain the benefit of a paired difference experiment.
(Essay)
4.9/5 (35)
A marketing study was conducted to compare the mean age of male and female purchasers of a certain product. Random and independent samples were selected for both male and female
Purchasers of the product. It was desired to test to determine if the mean age of all female
Purchasers exceeds the mean age of all male purchasers. The sample data is shown here:
Female: n = 10, sample mean = 50.30, sample standard deviation = 13.215
Male: n = 10, sample mean = 39.80, sample standard deviation = 10.040
Which of the following assumptions must be true in order for the pooled test of hypothesis to be
Valid?
I. Both the male and female populations of ages must possess approximately normal probability
Distributions.
II. Both the male and female populations of ages must possess population variances that are
Equal.
III. Both samples of ages must have been randomly and independently selected from their
Respective populations.
(Multiple Choice)
4.9/5 (36)
The FDA is comparing the mean caffeine contents of two brands of cola. Independent random samples of 6-oz. cans of each brand were selected and the caffeine content of each can determined.
The study provided the following summary information. Brand A Brand B Sample size 15 10 Mean 18 20 Variance 1.2 1.5
How many cans of each soda would need to be sampled in order to estimate the difference in the mean caffeine content to within . 10 with reliability?
(Multiple Choice)
4.9/5 (35)
Consider the following set of salary data: Men (1) Women (2) Sample Size 100 80 Mean \ 12,850 \ 13,000 Standard Deviation \ 345 \ 500
Calculate the appropriate test statistic for a test about .
(Multiple Choice)
4.9/5 (36)
A government housing agency is comparing home ownership rates among several
immigrant groups. In a sample of 235 families who emigrated to the U.S. from Eastern
Europe five years ago, 165 now own homes. In a sample of 195 families who emigrated to
the U.S. from Pacific islands five years ago, 125 now own homes. Write a 95% confidence
interval for the difference in home ownership rates between the two groups. Based on the
confidence interval, can you conclude that there is a significant difference in home
ownership rates in the two groups of immigrants?
(Essay)
4.8/5 (36)
Calculate the degrees of freedom associated with a small-sample test of hypothesis for , assuming and .
(Multiple Choice)
4.8/5 (43)
We are interested in comparing the average supermarket prices of two leading colas. Our sample was taken by randomly selecting eight supermarkets and recording the price of a six-pack of each
Brand of cola at each supermarket. The data are shown in the following table: 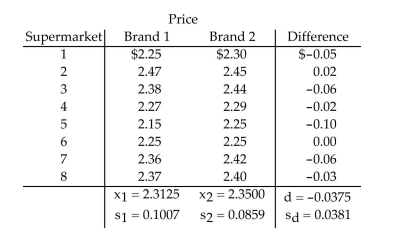 Find a confidence interval for the difference in mean price of brand 1 and brand 2 .
(Multiple Choice)
4.7/5 (34)
We sampled 100 men and 100 women and asked: ʺDo you think the environment is a major concern?ʺ Of those sampled, 67 women and 53 men responded that they believed it is. For the
Confidence interval procedure to work properly, what additional assumptions must be satisfied?
(Multiple Choice)
4.9/5 (39)
The owners of an industrial plant want to determine which of two types of fuel (gas or electricity) will produce more useful energy at a lower cost. The cost is measured by plant investment per delivered quad (\$ invested /quadrillion BTUs). The smaller this number, the less the industrial plant pays for delivered energy. Random samples of 11 similar plants using electricity and 16 similar plants using gas were taken, and the plant investment/quad was calculated for each. In an analysis of the difference of means of the two samples, the owners were able to reject in the test vs. . What is our best interpretation of the result?
(Multiple Choice)
4.8/5 (36)
Consider the following set of salary data: Men (1) Women (2) Sample Size 100 80 Mean \ 12,850 \ 13,000 Standard Deviation \ 345 \ 500
To determine if women have a higher mean salary than men, we would test:
(Multiple Choice)
4.9/5 (33)
Data was collected from CEOs of companies within both the low-tech industry and the consumer products industry. The following printout compares the mean return-to-pay ratios between CEOs
In the low-tech industry and CEOs in the consumer products industry. HYPOTHESIS: MEAN X = MEAN Y
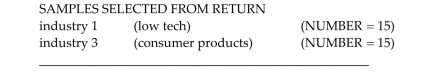
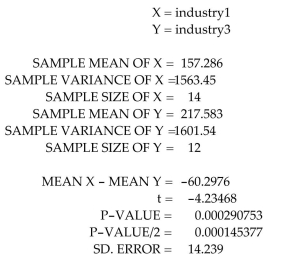 Using the printout above, find the test statistic necessary for testing whether the mean return-to-pay ratio of low tech CEO's exceeds the return-to-pay ratio of consumer product CEOs.
(Multiple Choice)
4.8/5 (40)
An inventor has developed a new spray coating that is designed to improve the wear of bicycle tires. To test the new coating, the inventor randomly selects one of the two tires on each of 50
Bicycles to be coated with the new spray. The bicycle is then driven for 100 miles and the amount
Of the depth of the tread left on the two bicycle tires is measured (in millimeters). It is desired to
Determine whether the new spray coating improves the wear of the bicycle tires. The data and
Summary information is shown below: 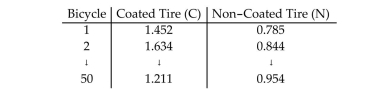
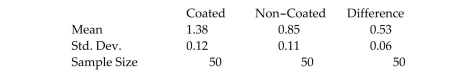 Identify the correct null and alternative hypothesis for testing whether the new spray coating improves the mean wear of the bicycle tires (which would result in a larger amount of tread left on the tire).
(Multiple Choice)
4.9/5 (37)
Filters
- Essay(0)
- Multiple Choice(0)
- Short Answer(0)
- True False(0)
- Matching(0)