Exam 9: Inferences Based on Two Samples: Confidence Intervals and Tests of Hypotheses
Exam 1: Statistics, Data, and Statistical Thinking77 Questions
Exam 2: Methods for Describing Sets of Data187 Questions
Exam 3: Probability284 Questions
Exam 4: Discrete Random Variables134 Questions
Exam 5: Continuous Random Variables138 Questions
Exam 6: Sampling Distributions52 Questions
Exam 7: Inferences Based on a Single Sample: Estimation With Confidence Intervals125 Questions
Exam 8: Inferences Based on a Single144 Questions
Exam 9: Inferences Based on Two Samples: Confidence Intervals and Tests of Hypotheses100 Questions
Exam 10: Analysis of Variance: Comparing More Than Two Means91 Questions
Exam 11: Simple Linear Regression113 Questions
Exam 12: Multiple Regression and Model Building131 Questions
Exam 13: Categorical Data Analysis60 Questions
Exam 14: Nonparametric Statistics Available Online87 Questions
Select questions type
Identify the rejection region that should be used to test against for , and .
(Multiple Choice)
4.9/5  (35)
(35)
When blood levels are low at an area hospital, a call goes out to local residents to give blood. The blood center is interested in determining which sex - males or females - is more likely to respond. Random, independent samples of 60 females and 100 males were each asked if they would be willing to give blood when called by a local hospital. A success is defined as a person who responds to the call and donates blood. The goal is to compare the percentage of the successes of the male and female responses. Suppose 45 of the females and 60 of the males responded that they were able to give blood. Find the test statistic that would be used if it is desired to test to determine if a difference exists between the proportion of the females and males who responds to the call to donate blood.
(Multiple Choice)
4.8/5 (40)
We are interested in comparing the average supermarket prices of two leading colas. Our sample was taken by randomly selecting eight supermarkets and recording the price of a six-pack of each
Brand of cola at each supermarket. The data are shown in the following table: 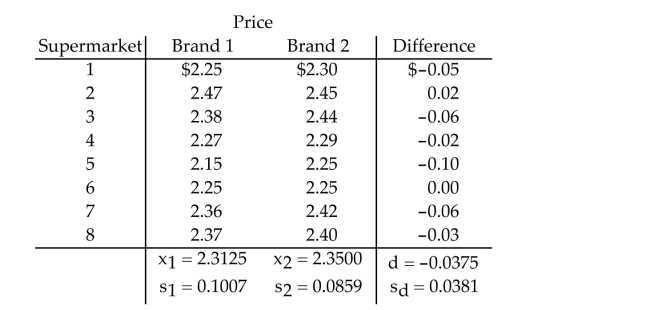 If the problem above represented a paired difference, what assumptions are needed for a
Confidence interval for the mean difference to be valid?
If the problem above represented a paired difference, what assumptions are needed for a
Confidence interval for the mean difference to be valid?
(Multiple Choice)
4.9/5 (43)
In a controlled laboratory environment, a random sample of 10 adults and a random sample of 10 children were tested by a psychologist to determine the room temperature that each person finds
Most comfortable. The data are summarized below: Sample Mean Sample Variance Adults (1) 77. 4.5 Children (2) 74. 2.5 Find the standard error of the estimate for the difference in mean comfortable room temperatures
Between adults and children.
(Multiple Choice)
4.8/5 (42)
University administrators are trying to decide where to build a new parking garage on campus. The state legislature has budgeted just enough money for one parking structure on campus. The administrators have determined that the parking garage will be built either by the college of engineering or by the college of business. To help make the final decision, the university has randomly and independently asked students from each of the two colleges to estimate how long they usually take to find a parking spot on campus (in minutes). Suppose that the sample sizes selected by the university for the two samples were both . What critical value should be used by the university in the calculations for the confidence interval for ? Assume that the university used the pooled estimate of the population variances in the calculation of the confidence interval.
(Multiple Choice)
4.9/5 (30)
One indication of how strong the real estate market is performing is the proportion of
properties that sell in less than 30 days after being listed. Of the condominiums in a
Florida beach community that sold in the first six months of 2006, 75 of the 115 sampled
had been on the market less than 30 days. For the first six months of 2007, 25 of the 85
sampled had been on the market less than 30 days. Test the hypothesis that the proportion
of condominiums that sold within 30 days decreased from 2006 to
(Essay)
4.8/5 (39)
A certain manufacturer is interested in evaluating two alternative manufacturing plans consisting of different machine layouts. Because of union rules, hours of operation vary greatly for this
Particular manufacturer from one day to the next. Twenty-eight random working days were
Selected and each plan was monitored and the number of items produced each day was recorded.
Some of the collected data is shown below: DAY PLAN 1 OUTPUT PLAN 2 OUTPUT 1 1234 units 1311 units 2 1355 units 1366 units 3 1300 units 1289 units What assumptions are necessary for the above test to be valid?
(Multiple Choice)
4.8/5 (38)
In order for the results of a paired difference experiment to be unbiased, the experimental units in
each pair must be chosen independently of one another.
(True/False)
4.8/5 (33)
Independent random samples, each containing 500 observations were selected from two binomial populations. The samples from populations 1 and 2 produced 210 and 320 successes, respectively. Test against . Use .
(Essay)
4.8/5 (27)
A new type of band has been developed for children who have to wear braces. The new
bands are designed to be more comfortable, look better, and provide more rapid progress
in realigning teeth. An experiment was conducted to compare the mean wearing time
necessary to correct a specific type of misalignment between the old braces and the new
bands. One hundred children were randomly assigned, 50 to each group. A summary of
the data is shown in the table. Old Braces New Bands 410 days 380 days s 41 days 64 days How many patients would need to be sampled to estimate the difference in means to
within 31 days with probability 99%?
(Essay)
4.8/5 (31)
In a controlled laboratory environment, a random sample of 10 adults and a random sample of 10 children were tested by a psychologist to determine the room temperature that each person finds
Most comfortable. The data are summarized below: Sample Mean Sample Variance Adults (1) 77. 4.5 Children (2) 74. 2.5 Suppose that the psychologist decides to construct a 99% confidence interval for the difference in
Mean comfortable room temperatures instead of proceeding with a test of hypothesis. The 99%
Confidence interval turns out to be (-2.9, 3.1). Select the correct statement.
(Multiple Choice)
4.8/5 (43)
Identify the rejection region that should be used to test against for , and .
(Multiple Choice)
4.9/5 (37)
A marketing study was conducted to compare the mean age of male and female purchasers of a certain product. Random and independent samples were selected for both male and female
Purchasers of the product. It was desired to test to determine if the mean age of all female
Purchasers exceeds the mean age of all male purchasers. The sample data is shown here:  Suppose the test statistic was calculated to be the value, . Use the rejection region to state the correct conclusion when testing at alpha .
(Multiple Choice)
5.0/5 (35)
A marketing study was conducted to compare the variation in the age of male and female purchasers of a certain product. Random and independent samples were selected for both male
And female purchasers of the product. The sample data is shown here: 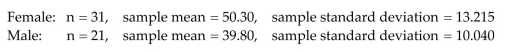 Calculate the test statistics that should be used to determine if the variation in the female ages exceeds the variation in the male ages.
(Multiple Choice)
5.0/5 (40)
A new weight-reducing technique, consisting of a liquid protein diet, is currently
undergoing tests by the Food and Drug Administration (FDA)before its introduction into
the market. The weights of a random sample of five people are recorded before they are
introduced to the liquid protein diet. The five individuals are then instructed to follow the
liquid protein diet for 3 weeks. At the end of this period, their weights (in pounds)are
again recorded. The results are listed in the table. Let μ1 be the true mean weight of
individuals before starting the diet and let μ2 be the true mean weight of individuals after
3 weeks on the diet. Person Weight Before Diet Weight After Diet 1 163 156 2 208 203 3 201 198 4 210 204 5 217 213 Summary information is as follows: =5,sd=1.58 . Calculate a 90% confidence interval for the difference between the mean weights before
and after the diet is used.
(Essay)
4.8/5 (41)
Independent random samples selected from two normal populations produced the
following sample means and standard deviations. Sample 1 Sample 2 =14 =11 =7.1 =8.4 =2.3 =2.9
Conduct the test against. , Use .
(Essay)
4.9/5 (36)
A marketing study was conducted to compare the mean age of male and female purchasers of a certain product. Random and independent samples were selected for both male and female
Purchasers of the product. What type of analysis should be used to compare the mean age of male
And female purchasers?
(Multiple Choice)
4.9/5 (50)
Independent random samples were selected from each of two normally distributed populations, from population 1 and from population 2 . The data are shown below.
Population 1: 2.5 3.1 2.3 1.8 4.2 3.5 3.9
Population 2: 2.9 1.7 4.6 3.5 3.7 2.8 4.6 3.4 1.9
Find the test statistic for the test of against .
(Multiple Choice)
4.8/5 (43)
Filters
- Essay(0)
- Multiple Choice(0)
- Short Answer(0)
- True False(0)
- Matching(0)