Exam 4: Describing the Relation Between Two Variables
Exam 1: Data Collection118 Questions
Exam 2: Creating Tables and Drawing Pictures of Data77 Questions
Exam 3: Numerically Summarizing Data158 Questions
Exam 4: Describing the Relation Between Two Variables183 Questions
Exam 5: Probability266 Questions
Exam 6: Discrete Probability Distributions149 Questions
Exam 7: The Normal Probability Distribution123 Questions
Exam 8: Sampling Distributions46 Questions
Exam 9: Estimating the Value of a Parameter Using Confidence Intervals109 Questions
Exam 10: Hypothesis Tests Regarding a Parameter156 Questions
Exam 11: Inference on Two Samples125 Questions
Exam 12: Inference on Categorical Data39 Questions
Exam 13: Comparing Three or More Means51 Questions
Exam 14: Inference of the Least-Squares Regression Model and Multiple Regression82 Questions
Exam 15: Nonparametric Statistics74 Questions
Select questions type
Provide an appropriate response.
-A manager wishes to determine the relationship between the number of years the manager's sales representatives have been with the company and their average monthly sales (in thousands of dollars). Calculate the linear correlation coefficient.

(Multiple Choice)
4.9/5  (35)
(35)
Choose the one alternative that best completes the statement or answers the question.
-Each year a nationally recognized publication conducts its "Survey of America's Best Graduate and Professional Schools." An academic advisor wants to predict the typical starting salary of a graduate at a top business school using GMAT score of the school as a predictor variable. A simple linear regression of SALARY versus GMAT using 25 data points shown below.
Give a practical interpretation of .
(Multiple Choice)
4.9/5 (42)
Write the word or phrase that best completes each statement or answers the question.
-In a study of feeding behavior, zoologists recorded the number of grunts of a warthog feeding by a lake in the 15 minute period following the addition of food. The data showing the weekly number of grunts and the age of the warthog (in days) are listed below:
Week Number of Grunts Age (days) 1 81 116 2 59 132 3 30 146 4 35 151 5 54 158 6 31 165 7 53 174 8 8 180 9 11 186
a. Write the equation of a straight-line model relating number of grunts (y) to age .
b. Give the least squares prediction equation.
c. Give a practical interpretation of the value of if possible.
d. Give a practical interpretation of the value of if possible.
(Short Answer)
4.9/5 (29)
Interpret the Slope and the y-intercept of the Least-Squares Regression Line
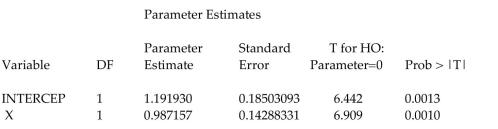
-Civil engineers often use the straight-line equation, , to model the relationship between the mean shear strength of masonry joints and precompression stress, . To test this theory, a series of stress tests were performed on solid bricks arranged in triplets and joined with mortar. The precompression stress was varied for each triplet and the ultimate shear load just before failure (called the shear strength) was recorded. The stress results for triplet tests is shown in the accompanying table followed by a SAS printout of the regression analysis.
Give a practical interpretation of the estimate of the -intercept of the least squares line.
Triplet Test 1 2 3 4 5 6 7 Shear Strength, y (tons) 1.00 2.18 2.24 2.41 2.59 2.82 3.06 Precomp. Stress, x (tons) 0 0.60 1.20 1.33 1.43 1.75 1.75
Analysis of Variance DF Sum of Mean Source Squares Square F Value Prob > F Model 1 2.39555 2.39555 47.732 0.0010 Error 5 0.25094 0.05019 C Total 6 2.64649
Root MSE 0.22403 R-square 0.9052 Dep Mean 2.32857 Adj R-sq 0.8862 C.V. 9.62073
(Multiple Choice)
4.8/5 (28)
Find the Least-Squares Regression Line and Use the Line to Make Predictions
-Find the equation of the regression line for the given data.
(Multiple Choice)
4.7/5 (28)
Write the word or phrase that best completes each statement or answers the question.
-The coefficient of determination for a straight-line model relating selling price y to manufacturing cost x for a particular item is . Interpret this value.
(Essay)
4.9/5 (41)
Choose the one alternative that best completes the statement or answers the question.
-Given the equation of a regression line is , what is the best predicted value for given ?
(Multiple Choice)
4.8/5 (29)
Choose the one alternative that best completes the statement or answers the question.
Make a scatter diagram for the data. Use the scatter diagram to describe how, if at all, the variables are related.
- Subject A B C D E F G x Time watching TV 12 8 6 11 11 9 10 y Time on Internet 7 5 1 10 11 2 11
(Multiple Choice)
4.7/5 (17)
Write the expression as a sum of logs. Express powers as factors.
-
(Multiple Choice)
4.8/5 (27)
Compute and Interpret the Coefficient of Determination
-In a study of feeding behavior, zoologists recorded the number of grunts of a warthog feeding by a lake in the 15 minute period following the addition of food. The data showing the weekly number of grunts and the age of the warthog (in days) are listed below. Find and interpret the value of .
Number of Grunts Age (days) 82 117 60 133 31 147 36 152 55 159 32 166 54 175 9 181 12 187
(Short Answer)
4.8/5 (38)
Write the word or phrase that best completes each statement or answers the question.
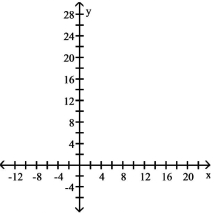
Construct a scatter diagram for the data.
-A manager wishes to determine the relationship between the number of miles (in hundreds of miles) the manager's sales representatives travel per month and the amount of sales (in thousands of dollars) per month.
Miles traveled, 2 3 10 7 8 15 3 1 11 Sales, y 31 33 78 62 65 61 48 55 120
(Short Answer)
4.8/5 (39)
Provide an appropriate response.
-Calculate the linear correlation coefficient for the data below.
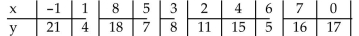
(Multiple Choice)
4.9/5 (36)
Choose the one alternative that best completes the statement or answers the question.
-The data below are the number of absences and the salaries (in thousands of dollars) of 9 randomly selected employees from an engineering firm. What is the best predicted value for given ?

(Multiple Choice)
4.8/5 (37)
Choose the one alternative that best completes the statement or answers the question.
-Use the regression equation to predict the value of for .
(Multiple Choice)
5.0/5 (34)
Find the Least-Squares Regression Line and Use the Line to Make Predictions
-In order for a company's employees to work in a foreign office, they must take a test in the language of the country where they plan to work. The data below shows the relationship between the number of years that employees have studied a particular language and the grades they received on the proficiency exam. Find the equation of the regression line for the given data.
Number of years, 3 4 4 5 3 6 2 7 3 Grades on test, 61 68 75 82 73 90 58 93 72
(Multiple Choice)
4.8/5 (31)
Choose the one alternative that best completes the statement or answers the question.
Make a scatter diagram for the data. Use the scatter diagram to describe how, if at all, the variables are related.
- x 9 7 2 6 5 11 4 y 20 22 18 21 24 20 27
(Multiple Choice)
4.8/5 (26)
Write the word or phrase that best completes each statement or answers the question.
-The data in the table are typical prices for a gallon of regular leaded gasoline and a barrel of crude oil for the indicated years.
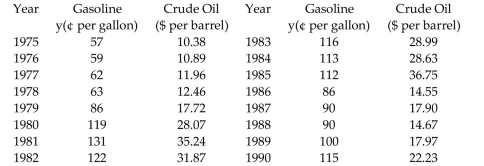 Summary statistics yield: , and . Find the least squares line that uses crude oil price to predict gasoline price.
(Short Answer)
4.8/5 (25)
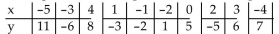
Find the Least-Squares Regression Line and Use the Line to Make Predictions
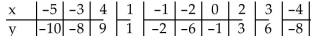
-Find the equation of the regression line for the given data.
-5 -3 4 1 -1 -2 0 2 3 -4 -10 -8 9 1 -2 -6 -1 3 6 -8
(Multiple Choice)
4.7/5 (34)
Choose the one alternative that best completes the statement or answers the question.
Use the scatter diagrams shown, labeled a through f to solve the problem.
-A medical researcher wishes to determine if there is a relationship between the number of prescriptions written by medical professionals, per 100, children and the childʹs age. She surveys all the pediatricianʹs in a geographical region to collect her data. What is the response variable
(Multiple Choice)
4.9/5 (38)
Choose the one alternative that best completes the statement or answers the question.
-The following data represent the height (relative to the ground) of a projectile shot into the air after seconds of travel. Determine the "best" model to describe the relationship between travel time and height.
Travel Time (seconds), Height (feet), y 8 890 9 869 10 798 11 708 12 571
(Multiple Choice)
4.9/5 (32)
Filters
- Essay(0)
- Multiple Choice(0)
- Short Answer(0)
- True False(0)
- Matching(0)