Exam 4: Describing the Relation Between Two Variables
Exam 1: Data Collection118 Questions
Exam 2: Creating Tables and Drawing Pictures of Data77 Questions
Exam 3: Numerically Summarizing Data158 Questions
Exam 4: Describing the Relation Between Two Variables183 Questions
Exam 5: Probability266 Questions
Exam 6: Discrete Probability Distributions149 Questions
Exam 7: The Normal Probability Distribution123 Questions
Exam 8: Sampling Distributions46 Questions
Exam 9: Estimating the Value of a Parameter Using Confidence Intervals109 Questions
Exam 10: Hypothesis Tests Regarding a Parameter156 Questions
Exam 11: Inference on Two Samples125 Questions
Exam 12: Inference on Categorical Data39 Questions
Exam 13: Comparing Three or More Means51 Questions
Exam 14: Inference of the Least-Squares Regression Model and Multiple Regression82 Questions
Exam 15: Nonparametric Statistics74 Questions
Select questions type
Compute the Sum of Squared Residuals
-The regression line for the given data is . Determine the residual of a data point for which 65 and .
Age, 38 41 45 48 51 53 57 61 65 Pressure, 116 120 123 131 142 145 148 150 152
(Multiple Choice)
4.8/5  (34)
(34)
Provide an appropriate response.
-In order for a company's employees to work in a foreign office, they must take a test in the language of the country where they plan to work. The data below shows the relationship between the number of years that employees have studied a particular language and the grades they received on the proficiency exam. Calculate the linear correlation coefficient.

(Multiple Choice)
4.9/5 (38)
Write the word or phrase that best completes each statement or answers the question.
-A company keeps extensive records on its new salespeople on the premise that sales should increase with experience. A random sample of seven new salespeople produced the data on experience and sales shown in the table.
Months on Job Monthly Sales y (\ thousands) 2 2.4 4 7.0 8 11.3 12 15.0 1 0.8 5 3.7 9 12.0
Summary statistics yield , and . Find and interpret the coefficient of determination.
(Short Answer)
5.0/5 (39)
Choose the one alternative that best completes the statement or answers the question.
-The data below are the ages and systolic blood pressures (measured in millimeters of mercury) of 9 randomly selected adults. What is the best predicted value for given ?

(Multiple Choice)
4.8/5 (34)
Write the word or phrase that best completes each statement or answers the question.
Provide an appropriate response.
-A college counselor wants to determine if the number of hours spent studying for a test can be used to predict the grades on a test. Identify the predictor variable and the response variable.
(Essay)
4.8/5 (27)
Find the Least-Squares Regression Line and Use the Line to Make Predictions
-The data below are the average one-way commute times (in minutes) for selected students and the number of absences for those students during the term. Find the equation of the regression line for the given data. What would be the predicted number of absences if the commute time was 95 minutes? Is this a reasonable question? Round the predicted number of absences to the nearest whole number.

(Multiple Choice)
4.9/5 (28)
Choose the one alternative that best completes the statement or answers the question.
-The data below are the temperatures on randomly chosen days during the summer in one city and the number of employee absences on those days for a company located in the same city. What is the best predicted value for given ?

(Multiple Choice)
4.9/5 (40)
Compute the Sum of Squared Residuals
-The regression line for the given data is . Determine the residual of a data point for which and .
(Multiple Choice)
4.8/5 (42)
Compute the Sum of Squared Residuals
-The regression line for the given data is . Determine the residual of a data point for which 8 and .
Years employed, 2 3 10 7 8 15 3 1 11 Sales, y 31 33 78 62 65 61 48 55 120
(Multiple Choice)
4.9/5 (32)
Provide an appropriate response.
-The following data represent the living situation of newlyweds in a large metropolitan area and their annual household income. What percent of people who make between and per year own their own home?
<\ 20,000 \ 20-35,000 \ 35-50,000 \ 50-75,000 >\ 75,000 Own home 31 52 202 355 524 Rent home 67 66 52 23 11 Live w/family 89 69 30 4 2
(Multiple Choice)
4.9/5 (38)
Write the expression as a sum of logs. Express powers as factors.
-
(Multiple Choice)
4.9/5 (29)
Provide an appropriate response.
-A contingency table relates
(Multiple Choice)
5.0/5 (46)
Interpret the Slope and the y-intercept of the Least-Squares Regression Line
-A county real estate appraiser wants to develop a statistical model to predict the appraised value of houses in a section of the county called East Meadow. One of the many variables thought to be an important predictor of appraised value is the number of rooms in the house. Consequently, the appraiser decided to fit the simple linear regression model, , where appraised value of the house (in \$thousands) and number of rooms. Using data collected for a sample of houses in East Meadow, the following results were obtained:
=74.80+19.72 \beta=71.24,=1.05 (for testing \beta0 ) \beta=2.63,=7.49 (for testing ) =60,775,=841,=29,=0.44
Range of the x-values:
Range of the -values:
Give a practical interpretation of the estimate of the -intercept of the least squares line.
(Multiple Choice)
4.8/5 (22)
Find the Least-Squares Regression Line and Use the Line to Make Predictions
-The data below are the final exam scores of 10 randomly selected history students and the number of hours they slept the night before the exam. Find the equation of the regression line for the given data. What would be the predicted score for a history student who slept 15 hours the previous night? Is this a reasonable question? Round your predicted score to the nearest whole number.

(Multiple Choice)
4.8/5 (38)
Provide an appropriate response.
-Researchers conducted a study to determine which of two different treatments, A or B, is more effective in the treatment of atherosclerosis. The results of their experiment are given in the table. (a) Which treatment appears to be more effective? Why?
Treatment A Treatment B Effective 420 435 Not effective 130 140
The data in the table do not take into account the seriousness of the case. The data shown in the next table show the effectiveness of each treatment for both mild and advanced cases of atherosclerosis.
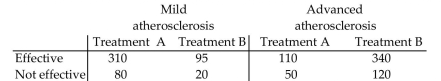 (b) Determine the proportion of mild cases of atherosclerosis that were effectively dealt with using treatment A. Determine the proportion of mild cases of atherosclerosis that were effectively dealt with using treatment B.
(c) Repeat part (b) for advanced cases of atherosclerosis to create a conditional distribution of effectiveness by treatment for each category of the disease.
(d) Write a short report detailing and explaining your findings.
(b) Determine the proportion of mild cases of atherosclerosis that were effectively dealt with using treatment A. Determine the proportion of mild cases of atherosclerosis that were effectively dealt with using treatment B.
(c) Repeat part (b) for advanced cases of atherosclerosis to create a conditional distribution of effectiveness by treatment for each category of the disease.
(d) Write a short report detailing and explaining your findings.
(Essay)
4.9/5 (32)
Compute the linear correlation coefficient between the two variables and determine whether a linear relation exists.
-The table below shows the scores on an end-of-year project of 10 randomly selected architecture students and the number of days each student spent working on the project.
Days, 1 3 0 6 0 2 2 3 4 1 Score, 69 84 64 92 70 82 89 94 94 75
(Multiple Choice)
4.7/5 (27)
Choose the one alternative that best completes the statement or answers the question.
-Given the following least squares prediction equation, , we estimate to____ by______ with each 1 -unit increase in .
(Multiple Choice)
4.8/5 (35)
Write the word or phrase that best completes each statement or answers the question.
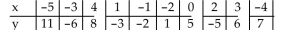
-Find the equation of the regression line by letting Row 1 represent the -values and Row 2 represent the -values. Now find the equation of the regression line letting Row 2 represent the -values and Row 1 represent the -values. What effect does switching the explanatory and response variables have on the regression line?
Row 1 -5 -3 4 1 -1 -2 0 2 3 -4 Row 2 -10 -8 9 1 -2 -6 -1 3 6 -8
(Essay)
4.8/5 (34)
Provide an appropriate response.
-The following data represent the living situation of newlyweds in a large metropolitan area and their annual household income. What, if any, association exists between living situation and household income? Discuss the association.
<\ 20,000 \ 20-35,000 \ 35-50,000 \ 50-75,000 >\ 75,000 Own home 31 52 202 355 524 Rent home 67 66 52 23 11 Live w/family 89 69 30 4 2
(Essay)
4.8/5 (38)
Choose the one alternative that best completes the statement or answers the question.
-The following data represent the bacteria population in a laboratory experiment. The researchers suspect that the population is growing exponentially. Find the exponential equation of best fit.
Day, x Population, y 0 1952 1 5319 2 14410 3 39279 4 106845 5 290613
(Multiple Choice)
4.8/5 (27)
Filters
- Essay(0)
- Multiple Choice(0)
- Short Answer(0)
- True False(0)
- Matching(0)