Exam 4: Describing the Relation Between Two Variables
Exam 1: Data Collection118 Questions
Exam 2: Creating Tables and Drawing Pictures of Data77 Questions
Exam 3: Numerically Summarizing Data158 Questions
Exam 4: Describing the Relation Between Two Variables183 Questions
Exam 5: Probability266 Questions
Exam 6: Discrete Probability Distributions149 Questions
Exam 7: The Normal Probability Distribution123 Questions
Exam 8: Sampling Distributions46 Questions
Exam 9: Estimating the Value of a Parameter Using Confidence Intervals109 Questions
Exam 10: Hypothesis Tests Regarding a Parameter156 Questions
Exam 11: Inference on Two Samples125 Questions
Exam 12: Inference on Categorical Data39 Questions
Exam 13: Comparing Three or More Means51 Questions
Exam 14: Inference of the Least-Squares Regression Model and Multiple Regression82 Questions
Exam 15: Nonparametric Statistics74 Questions
Select questions type
Write the word or phrase that best completes each statement or answers the question.
Construct a scatter diagram for the data.
-The data below are the final exam scores of 10 randomly selected history students and the number of hours they studied for the exam.
Hours, 3 5 2 8 2 4 4 5 6 3 Scores, 65 80 60 88 66 78 85 90 90 71
(Short Answer)
4.8/5  (28)
(28)
Write the expression as a sum of logs. Express powers as factors.
-
(Multiple Choice)
4.7/5 (34)
Compute the Sum of Squared Residuals
-The regression line for the given data is . Determine the residual of a data point for which and .

(Multiple Choice)
5.0/5 (37)
Write the word or phrase that best completes each statement or answers the question.
Construct a scatter diagram for the data.
-In order for employees of a company to work in a foreign office, they must take a test in the language of the country where they plan to work. The data below show the relationship between the number of years that employees have studied a particular language and the grades they received on the proficiency exam.
Number of years, 3 4 4 5 3 6 2 7 3 Grades on test, 61 68 75 82 73 90 58 93 72
(Short Answer)
4.8/5 (36)
Compute the Sum of Squared Residuals
-In a study of feeding behavior, zoologists recorded the number of grunts of a warthog feeding by a lake in a 15 minute time period following the addition of food. The data showing the weekly number of grunts and the age of the warthog (in days) are listed below. Compute the sum of the squared residuals of the least squared line for the given data. Week Number of Grunts Age (days) 1 90 125 2 68 141 3 39 155 4 44 160 5 63 167 6 40 174 7 62 183 8 17 189 9 20 195
(Multiple Choice)
4.7/5 (39)
A scatter diagram is given with one of the points labeled ʺA.ʺ In addition, there are two least -squares regression lines
drawn. The solid line excludes the point A. The dashed line includes the point A. Based on the graph, is the point A
influential
-An influential observation is an observation that significantly affects the value of the
(Multiple Choice)
4.9/5 (35)
Write the word or phrase that best completes each statement or answers the question.
-To investigate the relationship between yield of potatoes, , and level of fertilizer application, , an experimenter divides a field into eight plots of equal size and applies differing amounts of fertilizer to each. The yield of potatoes (in pounds) and the fertilizer application (in pounds) are recorded for each plot. The data are as follows:
1 1.5 2 2.5 3 3.5 4 4.5 25 31 27 28 36 35 32 34
Summary statistics yield SSxx , and SSxy . Calculate the coefficient of determination.
(Short Answer)
4.8/5 (33)
Choose the one alternative that best completes the statement or answers the question.
Use the scatter diagrams shown, labeled a through f to solve the problem.
-A traffic officer is compiling information about the relationship between the hour or the day and the speed over the limit at which the motorist is ticketed. He computes a correlation coefficient of 0.12. What does this tell the officer
(Multiple Choice)
4.8/5 (33)
Write the word or phrase that best completes each statement or answers the question.
-For a random sample of 30 countries, the linear correlation coefficient between the infant mortality rate and the average number of cars per capita was found to be r = -0.717. What does this imply Does this suggest that if people buy more cars, this could lower the infant mortality rate Why or why not What is a likely lurking variable
(Essay)
4.9/5 (33)
Compute the Sum of Squared Residuals
-The regression line for the given data is . Determine the residual of a data point for which and .
Rainfall (in inches), 10.5 8.8 13.4 12.5 18.8 10.3 7.0 15.6 16.0 Yield (bushels per acre), 50.5 46.2 58.8 59.0 82.4 49.2 31.9 76.0 78.8
(Multiple Choice)
4.9/5 (36)
Choose the one alternative that best completes the statement or answers the question.
-The data below are the final exam scores of 10 randomly selected chemistry students and the number of hours they slept the night before the exam. What is the best predicted value for given ?

(Multiple Choice)
5.0/5 (39)
Choose the one alternative that best completes the statement or answers the question.
-A real estate magazine reported the results of a regression analysis designed to predict the price (y), measured in dollars, of residential properties recently sold in a northern Virginia subdivision. One independent variable used to predict sale price is GLA, gross living area ( ), measured in square feet. Data for 157 properties were used to fit the model, . The results of the simple linear regression are provided below.
Interpret the value of the coefficient of determination, .
(Multiple Choice)
4.8/5 (32)
Provide an appropriate response.
-The data below are the number of hours worked (per week) and the final grades of 9 randomly selected students from a drama class. Calculate the linear correlation coefficient.

(Multiple Choice)
4.9/5 (34)
Write the word or phrase that best completes each statement or answers the question.
Construct a scatter diagram for the data.
-The scores of nine members of a local community college women's golf team in two rounds of tournament play are listed below.
Player 1 2 3 4 5 6 7 8 9 Round 1 85 90 87 78 92 85 79 93 86 Round 2 90 87 85 84 86 78 77 91 82
(Short Answer)
4.8/5 (35)
Write the expression as a sum of logs. Express powers as factors.
-
(Multiple Choice)
4.9/5 (36)
Provide an appropriate response.
-The data below are the average one-way commute times (in minutes) of selected students during a summer literature class and the number of absences for those students for the term. Calculate the linear correlation coefficient.

(Multiple Choice)
4.7/5 (41)
Compute the Sum of Squared Residuals
-In an area of the Great Plains, records were kept on the relationship between the rainfall (in inches) and the yield of wheat (bushels per acre). Compute the sum of the squared residuals of the least-squares line for the given data.
Rain fall (in inches), 10.5 8.8 13.4 12.5 18.8 10.3 7.0 15.6 16.0 Yield (bushels per acre), 50.5 46.2 58.8 59.0 82.4 49.2 31.9 76.0 78.8
(Multiple Choice)
4.8/5 (32)
Write the expression as a sum of logs. Express powers as factors.
-
(Multiple Choice)
4.9/5 (33)
Find the Least-Squares Regression Line and Use the Line to Make Predictions
-Find the equation of the regression line for the given data.
(Multiple Choice)
4.9/5 (37)
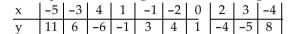
Find the Least-Squares Regression Line and Use the Line to Make Predictions
-The data below are the number of absences and the final grades of 9 randomly selected students from a literature class. Find the equation of the regression line for the given data. What would be the predicted final grade if a student was absent 14 times? Round the predicted grade to the nearest whole number.
Number of absences, 0 3 6 4 9 2 15 8 5 Final grade, 98 86 80 82 71 92 55 76 82
(Multiple Choice)
4.7/5 (34)
Filters
- Essay(0)
- Multiple Choice(0)
- Short Answer(0)
- True False(0)
- Matching(0)