Exam 4: Describing the Relation Between Two Variables
Exam 1: Data Collection118 Questions
Exam 2: Creating Tables and Drawing Pictures of Data77 Questions
Exam 3: Numerically Summarizing Data158 Questions
Exam 4: Describing the Relation Between Two Variables183 Questions
Exam 5: Probability266 Questions
Exam 6: Discrete Probability Distributions149 Questions
Exam 7: The Normal Probability Distribution123 Questions
Exam 8: Sampling Distributions46 Questions
Exam 9: Estimating the Value of a Parameter Using Confidence Intervals109 Questions
Exam 10: Hypothesis Tests Regarding a Parameter156 Questions
Exam 11: Inference on Two Samples125 Questions
Exam 12: Inference on Categorical Data39 Questions
Exam 13: Comparing Three or More Means51 Questions
Exam 14: Inference of the Least-Squares Regression Model and Multiple Regression82 Questions
Exam 15: Nonparametric Statistics74 Questions
Select questions type
Choose the one alternative that best completes the statement or answers the question.
Use the scatter diagrams shown, labeled a through f to solve the problem.
-Which scatter diagram indicates a perfect positive correlation 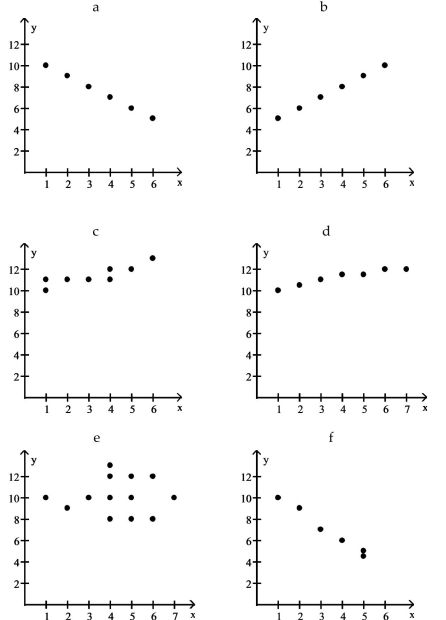
(Multiple Choice)
4.9/5  (37)
(37)
Write the word or phrase that best completes each statement or answers the question.
-A random sample of 200 men aged between 20 and 60 was selected from a certain city. The linear correlation coefficient between income and blood pressure was found to be r = 0.807. What does this imply Does this suggest that if a man gets a salary raise his blood pressure is likely to rise Why or why not What are likely lurking variables
(Essay)
4.7/5 (38)
Find the Least-Squares Regression Line and Use the Line to Make Predictions
-The data below are the final exam scores of 10 randomly selected history students and the number of hours they slept the night before the exam. Find the equation of the regression line for the given data. What would be the predicted score for a history student who slept 7 hours the previous night? Is this a reasonable question? Round your answer to the nearest whole number.

(Multiple Choice)
4.8/5 (35)
Perform Residual Analysis on a Regression Model
-If a residual plot shows an almost straight line then a linear model is appropriate.
(True/False)
4.8/5 (41)
Interpret the Slope and the y-intercept of the Least-Squares Regression Line
-A county real estate appraiser wants to develop a statistical model to predict the appraised value of houses in a section of the county called East Meadow. One of the many variables thought to be an important predictor of appraised value is the number of rooms in the house. Consequently, the appraiser decided to fit the simple linear regression model, , where appraised value of the house (in \$thousands) and number of rooms. Using data collected for a sample of houses in East Meadow, the following results were obtained:
=74.80+22.75x \beta=71.24,t=1.05 (for testing ) \beta=2.63,=7.49 (for testing ) =60,775,=841,=29,=.44
Range of the x-values:
Range of the -values:
Give a practical interpretation of the estimate of the slope of the least squares line.
(Multiple Choice)
4.7/5 (36)
Compute the linear correlation coefficient between the two variables and determine whether a linear relation exists.
- x 9 2 3 4 2 5 9 10 y 85 52 55 68 67 86 83 73
(Multiple Choice)
4.9/5 (36)
Choose the one alternative that best completes the statement or answers the question.
-Given the equation of a regression line is , what is the best predicted value for given ?
(Multiple Choice)
4.8/5 (29)
Choose the one alternative that best completes the statement or answers the question.
-In a comprehensive road test on all new car models, one variable measured is the time it takes a car to accelerate from 0 to 60 miles per hour. To model acceleration time, a regression analysis is conducted on a random sample of 129 new cars.
TIME60: Elapsed time (in seconds) from to
MAX: Maximum speed attained (miles per hour)
Initially, the simple linear model was fit to the data. Computer printouts for the analysis are given below:
UNWEIGHTED LEAST SQUARES LINEAR REGRESSION OF TIME60
PREDICTOR VARIABLES COEFFICIENT STD ERROR STUDENT'S T P CONSTANT 18.7171 0.63708 29.38 0.0000 MAX -0.08365 0.00491 -17.05 0.0000
R-SQUARED 0.6960 RESID. MEAN SQUARE (MSE) 1.28695 ADJUSTED R-SQUARED 0.6937 STANDARD DEVIATION 1.13444
SOURCE DF SS MS F P REGRESSION 1 374.285 374.285 290.83 0.0000 RESIDUAL 127 163.443 1.28695 TOTAL 128 537.728
CASES INCLUDED 129 MISSING CASES 0
Approximately what percentage of the sample variation in acceleration time can be explained by the simple linear model?
(Multiple Choice)
4.8/5 (33)
Choose the one alternative that best completes the statement or answers the question.
Use the scatter diagrams shown, labeled a through f to solve the problem.
-A history instructor has given the same pretest and the same final examination each semester. He is interested in determining if there is a relationship between the scores of the two tests. He computes the linear correlation coefficient and notes that it is 1.15. What does this correlation coefficient value tell the instructor
(Multiple Choice)
4.8/5 (36)
Compute the Sum of Squared Residuals
-The regression line for the given data is . Determine the residual of a data point for which 75 and .

(Multiple Choice)
4.8/5 (42)
Provide an appropriate response.
-A company encourages applications from minority groups who they feel are under-represented in the company. The table shows the number of applications that were accepted last year from people belonging to minority groups and the number of applications that were accepted from people not belonging to minority groups. Only applications from well qualified applicants are included in the analysis. (a) Does the acceptance rate appear to be higher for those belonging to minority groups or for those not belonging to minority groups ? Why?
Minority Not minority Accepted 70 79 Rejected 460 500
The data in the table do not take into account the department of the company. The data shown in the next table show the number of applications accepted from each group within each department.
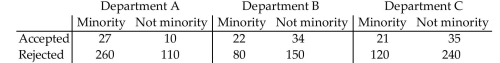 (b) Determine the proportion of minority applications that were accepted within department A. Determine the proportion of non-minority applications that were accepted within department A.
(c) Repeat part (b) for departments B and C to create a conditional distribution of acceptance rate by group for each department of the company.
(d) Write a short report detailing and explaining your findings.
(b) Determine the proportion of minority applications that were accepted within department A. Determine the proportion of non-minority applications that were accepted within department A.
(c) Repeat part (b) for departments B and C to create a conditional distribution of acceptance rate by group for each department of the company.
(d) Write a short report detailing and explaining your findings.
(Essay)
4.8/5 (33)
Write the word or phrase that best completes each statement or answers the question.
-For a random sample of 100 American cities, the linear correlation coefficient between the number of robberies last year and the number of schools in the city was found to be r = 0.725. What does this imply Does this suggest that building more schools in a city could lead to more robberies Why or why not What is a likely lurking variable
(Essay)
4.8/5 (37)
Choose the one alternative that best completes the statement or answers the question.
-In one area of Russia, records were kept on the relationship between the rainfall (in inches) and the yield of wheat (bushels per acre). The data for a 9 year period is as follows:
Rain Fall, 13.1 11.4 16.0 15.1 21.4 12.9 9.6 18.2 18.6 Yield, y 48.5 44.2 56.8 80.4 47.2 29.9 74.0 74.0 76.8
The equation of the line of least squares is given as . How many bushels of wheat per acre can be predicted if it is expected that there will be 17 inches of rain?
(Multiple Choice)
4.9/5 (33)
Choose the one alternative that best completes the statement or answers the question.
Use the scatter diagrams shown, labeled a through f to solve the problem.
-A researcher determines that the linear correlation coefficient is 0.85 for a paired data set. This indicates that there is
(Multiple Choice)
4.8/5 (35)
Choose the one alternative that best completes the statement or answers the question.
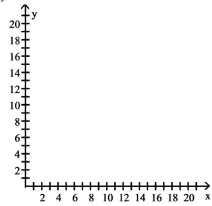
Make a scatter diagram for the data. Use the scatter diagram to describe how, if at all, the variables are related.
- x 7 12 10 9 13 8 y 4 7 5 5 6 3
(Multiple Choice)
4.8/5 (30)
Interpret the Slope and the y-intercept of the Least-Squares Regression Line
-Is there a relationship between the raises administrators at State University receive and their performance on the job? A faculty group wants to determine whether job rating (x) is a useful linear predictor of raise (y). Consequently, the group considered the straight-line regression model, . Using the method of least squares, the faculty group obtained the following prediction equation, . Interpret the estimated -intercept of the line.
(Multiple Choice)
4.8/5 (36)
The scatter diagram shows the relationship between average number of years of education and births per woman ofchild bearing age in selected countries. Use the scatter plot to determine whether the statement is true or false.
-There is a causal relationship between years of education and births per woman. 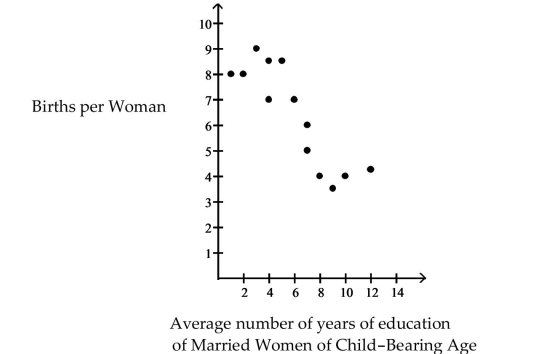
(Multiple Choice)
4.8/5 (28)
Compute the linear correlation coefficient between the two variables and determine whether a linear relation exists.
- -12 -10 -3 -6 -8 -9 -7 -5 -4 -11 -7 -5 12 4 1 -3 2 6 9 -5
(Multiple Choice)
4.7/5 (45)
Compute the linear correlation coefficient between the two variables and determine whether a linear relation exists.
- x -4 -2 5 2 0 -1 1 3 4 -3 y 3 -2 -14 -9 -5 -4 -7 -12 -13 0
(Multiple Choice)
4.9/5 (41)
Change the exponential expression to an equivalent expression involving a logarithm.
-
(Multiple Choice)
4.9/5 (41)
Filters
- Essay(0)
- Multiple Choice(0)
- Short Answer(0)
- True False(0)
- Matching(0)