Exam 2: Organizing and Visualizing Data
Exam 1: Introduction145 Questions
Exam 2: Organizing and Visualizing Data210 Questions
Exam 3: Numerical Descriptive Measures153 Questions
Exam 4: Basic Probability171 Questions
Exam 5: Discrete Probability Distributions218 Questions
Exam 6: The Normal Distribution and Other Continuous Distributions191 Questions
Exam 7: Sampling and Sampling Distributions197 Questions
Exam 8: Confidence Interval Estimation196 Questions
Exam 9: Fundamentals of Hypothesis Testing: One-Sample Tests165 Questions
Exam 10: Two-Sample Tests210 Questions
Exam 11: Analysis of Variance213 Questions
Exam 12: Chi-Square Tests and Nonparametric Tests201 Questions
Exam 13: Simple Linear Regression213 Questions
Exam 14: Introduction to Multiple Regression355 Questions
Exam 15: Multiple Regression Model Building96 Questions
Exam 16: Time-Series Forecasting168 Questions
Exam 17: Statistical Applications in Quality Management133 Questions
Exam 18: A Roadmap for Analyzing Data54 Questions
Exam 19: Questions that Involve Online Topics321 Questions
Select questions type
TABLE 2-12
The table below contains the opinions of a sample of 200 people broken down by gender about the latest congressional plan to eliminate anti-trust exemptions for professional baseball.
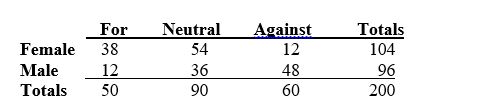 -Referring to Table 2-12,of the females in the sample,________ percent were against the plan.
(Short Answer)
4.9/5  (36)
(36)
TABLE 2-13
Given below is the stem-and-leaf display representing the amount of detergent used in gallons (with leaves in tenths of gallons)in a day by 25 drive-through car wash operations in Phoenix.
9 | 1 4 7
10 | 0 2 2 3 8
11 | 1 3 5 5 6 6 7 7 7
12 | 2 2 3 4 8 9
13 | 0 2
-Referring to Table 2-13,construct a frequency distribution for the detergent data,using "9.0 but less than 10.0 gallons" as the first class.
(Essay)
4.9/5 (33)
TABLE 2-14
The table below contains the number of people who own a portable DVD player in a sample of 600 broken down by gender.
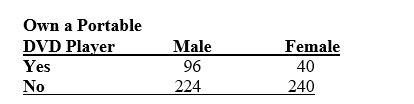 -Referring to Table 2-14,________ percent of the 600 were females.
(Short Answer)
4.9/5 (28)
TABLE 2-11
The ordered array below resulted from selecting a sample of 25 batches of 500 computer chips and determining how many in each batch were defective. 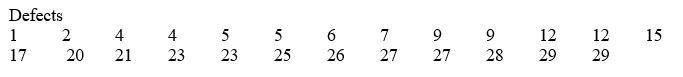 -Referring to Table 2-11,construct a relative frequency or percentage distribution for the defects data,using "0 but less than 5" as the first class.
(Essay)
4.8/5 (34)
TABLE 2-9
The frequency distribution below represents the rents of 250 randomly selected federally subsidized apartments in a small town. 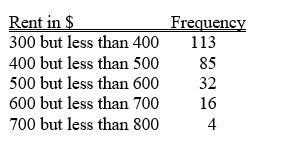 -Referring to Table 2-9,the percentage of apartments renting for less than $600 is ________.
(Essay)
4.8/5 (39)
TABLE 2-6
A sample of 200 students at a Big-Ten university was taken after the midterm to ask them whether they went bar hopping the weekend before the midterm or spent the weekend studying,and whether they did well or poorly on the midterm.The following table contains the result.
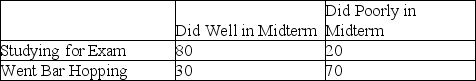 -Referring to Table 2-6,________ percent of the students in the sample went bar hopping the weekend before the midterm and did well on the midterm.
(Multiple Choice)
4.9/5 (37)
TABLE 2-12
The table below contains the opinions of a sample of 200 people broken down by gender about the latest congressional plan to eliminate anti-trust exemptions for professional baseball.
-Referring to Table 2-12,construct a table of total percentages.
(Essay)
4.8/5 (34)
TABLE 2-7
The Stem-and-Leaf display below contains data on the number of months between the date a civil suit is filed and when the case is actually adjudicated for 50 cases heard in superior court. 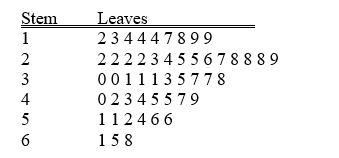 -Referring to Table 2-7,if a frequency distribution with equal sized classes was made from this data,and the first class was "10 but less than 20," the frequency of that class would be ________.
(Short Answer)
4.8/5 (38)
TABLE 2-7
The Stem-and-Leaf display below contains data on the number of months between the date a civil suit is filed and when the case is actually adjudicated for 50 cases heard in superior court.
-Referring to Table 2-7,________ percent of the cases were not adjudicated within the first 4 years.
(Short Answer)
4.8/5 (38)
A survey of 150 executives were asked what they think is the most common mistake candidates make during job interviews.Six different mistakes were given.Which of the following is the best for presenting the information?
(Multiple Choice)
4.8/5 (37)
TABLE 2-17
The following table presents total retail sales in millions of dollars for the leading apparel companies during April 2009 and April 2010.
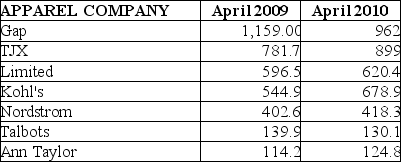 -Referring to Table 2-17,construct a table of column percentages.
(Essay)
4.9/5 (37)
TABLE 2-14
The table below contains the number of people who own a portable DVD player in a sample of 600 broken down by gender.
-Referring to Table 2-14,________ percent of the 600 owned a portable DVD.
(Short Answer)
4.8/5 (41)
Apple Computer,Inc.collected information on the age of their customers.The youngest customer was 12 and the oldest was 72.To study the percentage of their customers who are below a certain age,it can use an ogive.
(True/False)
4.8/5 (29)
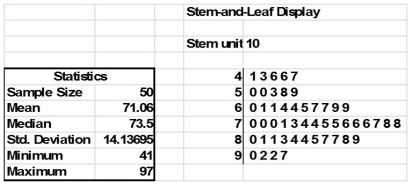
TABLE 2-8
The Stem-and-Leaf display represents the number of times in a year that a random sample of 100 "lifetime" members of a health club actually visited the facility.
 -Referring to Table 2-8,if a frequency distribution with equal sized classes was made from this data,and the first class was "0 but less than 10," the frequency of the fifth class would be ________.
(Short Answer)
4.9/5 (30)
Apple Computer,Inc.collected information on the age of their customers.The youngest customer was 12 and the oldest was 72.To study the distribution of the age among its customers,it is best to use a pie chart.
(True/False)
4.8/5 (37)
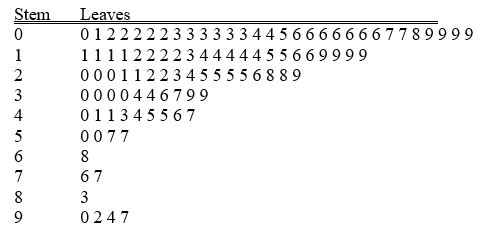
TABLE 2-18
The stem-and-leaf display below shows the result of a survey on 50 students on their satisfaction with their school with the higher scores represent higher level of satisfaction.
 -Referring to Table 2-18,what was the lowest level of satisfaction?
(Short Answer)
4.7/5 (25)
TABLE 2-3
Every spring semester,the School of Business coordinates a luncheon with local business leaders for graduating seniors,their families,and friends.Corporate sponsorship pays for the lunches of each of the seniors,but students have to purchase tickets to cover the cost of lunches served to guests they bring with them.The following histogram represents the attendance at the senior luncheon,where X is the number of guests each graduating senior invited to the luncheon and f is the number of graduating seniors in each category.
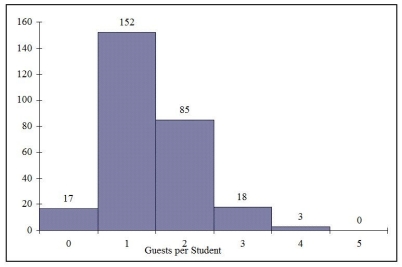 -Referring to the histogram from Table 2-3,how many graduating seniors attended the luncheon?
(Multiple Choice)
4.8/5 (40)
Retailers are always interested in determining why a customer selected their store to make a purchase.A sporting goods retailer conducted a customer survey to determine why its customers shopped at the store.The results are shown in the bar chart below.What proportion of the customers responded that they shopped at the store because of the merchandise or the convenience? 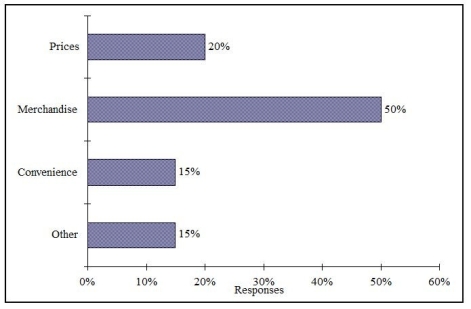
(Multiple Choice)
4.8/5 (35)
TABLE 2-6
A sample of 200 students at a Big-Ten university was taken after the midterm to ask them whether they went bar hopping the weekend before the midterm or spent the weekend studying,and whether they did well or poorly on the midterm.The following table contains the result.
-Referring to Table 2-6,if the sample is a good representation of the population,we can expect ________ percent of the students in the population to spend the weekend studying and do poorly on the midterm.
(Multiple Choice)
4.7/5 (33)
Filters
- Essay(0)
- Multiple Choice(0)
- Short Answer(0)
- True False(0)
- Matching(0)