Exam 2: Organizing and Visualizing Data
Exam 1: Introduction145 Questions
Exam 2: Organizing and Visualizing Data210 Questions
Exam 3: Numerical Descriptive Measures153 Questions
Exam 4: Basic Probability171 Questions
Exam 5: Discrete Probability Distributions218 Questions
Exam 6: The Normal Distribution and Other Continuous Distributions191 Questions
Exam 7: Sampling and Sampling Distributions197 Questions
Exam 8: Confidence Interval Estimation196 Questions
Exam 9: Fundamentals of Hypothesis Testing: One-Sample Tests165 Questions
Exam 10: Two-Sample Tests210 Questions
Exam 11: Analysis of Variance213 Questions
Exam 12: Chi-Square Tests and Nonparametric Tests201 Questions
Exam 13: Simple Linear Regression213 Questions
Exam 14: Introduction to Multiple Regression355 Questions
Exam 15: Multiple Regression Model Building96 Questions
Exam 16: Time-Series Forecasting168 Questions
Exam 17: Statistical Applications in Quality Management133 Questions
Exam 18: A Roadmap for Analyzing Data54 Questions
Exam 19: Questions that Involve Online Topics321 Questions
Select questions type
A marketing research firm,in conducting a comparative taste test,provided three types of peanut butter to a sample of households randomly selected within the state.Which of the 4 methods of data collection is involved when people are asked to compare the three types of peanut butter?
(Multiple Choice)
4.9/5  (38)
(38)
TABLE 2-14
The table below contains the number of people who own a portable DVD player in a sample of 600 broken down by gender.
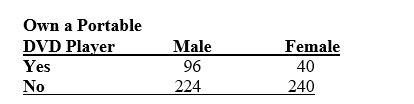 -Referring to Table 2-14,construct a table of row percentages.
(Essay)
4.9/5 (31)
TABLE 2-12
The table below contains the opinions of a sample of 200 people broken down by gender about the latest congressional plan to eliminate anti-trust exemptions for professional baseball.
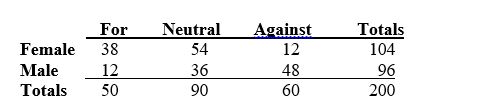 -Referring to Table 2-12,if the sample is a good representation of the population,we can expect ________ percent of the population will be males.
(Short Answer)
4.8/5 (41)
TABLE 2-13
Given below is the stem-and-leaf display representing the amount of detergent used in gallons (with leaves in tenths of gallons)in a day by 25 drive-through car wash operations in Phoenix.
9 | 1 4 7
10 | 0 2 2 3 8
11 | 1 3 5 5 6 6 7 7 7
12 | 2 2 3 4 8 9
13 | 0 2
-Referring to Table 2-13,if a frequency distribution for the amount of detergent used is constructed,using "9.0 but less than 10.0 gallons" as the first class,the frequency of the "11.0 but less than 12.0 gallons" class would be ________.
(Short Answer)
4.8/5 (29)
A Wal-Mart store in a small town monitors customer complaints and organizes these complaints into six distinct categories.Over the past year,the company has received 534 complaints.One possible graphical method for representing these data would be a Pareto chart.
(True/False)
4.9/5 (32)
TABLE 2-11
The ordered array below resulted from selecting a sample of 25 batches of 500 computer chips and determining how many in each batch were defective. 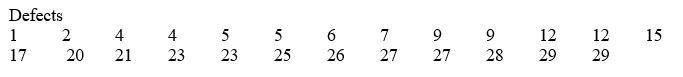 -Referring to Table 2-11,if a frequency distribution for the defects data is constructed,using "0 but less than 5" as the first class,the relative frequency of the "15 but less than 20" class would be ________.
(Short Answer)
4.9/5 (32)
TABLE 2-5
The following are the duration in minutes of a sample of long-distance phone calls made within the continental United States reported by one long-distance carrier. 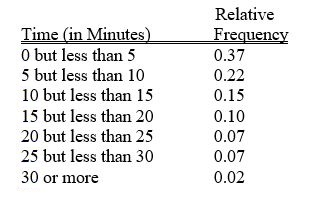 -Referring to Table 2-5,if 100 calls were randomly sampled,how many calls lasted 15 minutes or longer?
(Multiple Choice)
4.8/5 (26)
TABLE 2-7
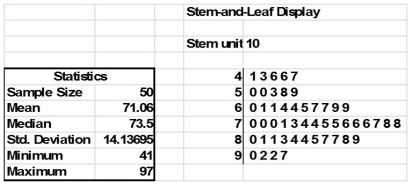
The Stem-and-Leaf display below contains data on the number of months between the date a civil suit is filed and when the case is actually adjudicated for 50 cases heard in superior court. 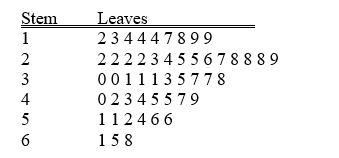 -Referring to Table 2-7,________ percent of the cases were adjudicated within the first 2 years.
(Short Answer)
4.8/5 (27)
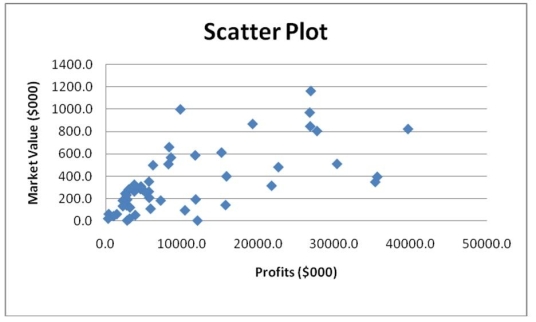
Given below is the scatter plot of the market value (thousands$)and profit (thousands$)of 50 U.S.companies.There appears to be a negative relationship between market value and profit.
(True/False)
4.7/5 (33)
TABLE 2-12
The table below contains the opinions of a sample of 200 people broken down by gender about the latest congressional plan to eliminate anti-trust exemptions for professional baseball.
-Referring to Table 2-12,of the females in the sample,________ percent were either neutral or against the plan.
(Short Answer)
4.8/5 (36)
It is essential that each class grouping or interval in a frequency distribution be ________ and ________.
(Essay)
4.9/5 (34)
TABLE 2-4
A survey was conducted to determine how people rated the quality of programming available on television.Respondents were asked to rate the overall quality from 0 (no quality at all)to 100 (extremely good quality).The stem-and-leaf display of the data is shown below. 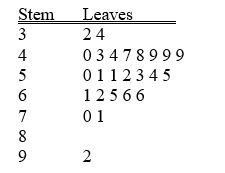 -Referring to Table 2-4,what percentage of the respondents rated overall television quality with a rating from 50 through 75?
(Multiple Choice)
4.9/5 (38)
When polygons or histograms are constructed,which axis must show the true zero or "origin"?
(Multiple Choice)
4.8/5 (43)
TABLE 2-16
The figure below is the percentage polygon for the amount of calories for a sample of 36 pizzas products where the upper limits of the intervals are: 310,340,370,400 and 430.
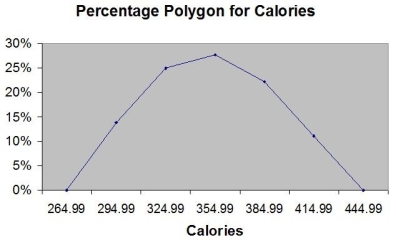 -Referring to Table 2-16,roughly what percentage of pizza products contains between 340 and 400 calories?
(Multiple Choice)
4.8/5 (33)
TABLE 2-18
The stem-and-leaf display below shows the result of a survey on 50 students on their satisfaction with their school with the higher scores represent higher level of satisfaction.
 -Referring to Table 2-18,how many students have a satisfaction level in the 50s?
(Short Answer)
4.9/5 (32)
TABLE 2-14
The table below contains the number of people who own a portable DVD player in a sample of 600 broken down by gender.
-Referring to Table 2-14,if the sample is a good representation of the population,we can expect ________ percent of the population will own a portable DVD.
(Short Answer)
4.9/5 (29)
Relationships in a contingency table can be examined more fully if the frequencies are converted into ________.
(Short Answer)
4.9/5 (43)
TABLE 2-7
The Stem-and-Leaf display below contains data on the number of months between the date a civil suit is filed and when the case is actually adjudicated for 50 cases heard in superior court.
-Referring to Table 2-7,the civil suit with the fourth shortest waiting time between when the suit was filed and when it was adjudicated had a wait of ________ months.
(Short Answer)
4.9/5 (32)
TABLE 2-10
The histogram below represents scores achieved by 200 job applicants on a personality profile.
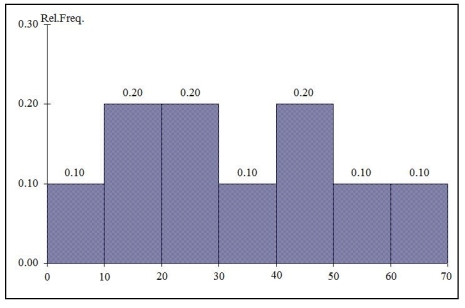 -Referring to the histogram from Table 2-10,________ percent of the job applicants scored between 10 and 20.
(Short Answer)
4.8/5 (41)
In constructing a polygon,each class grouping is represented by its ________ and then these are consecutively connected to one another.
(Short Answer)
4.9/5 (33)
Filters
- Essay(0)
- Multiple Choice(0)
- Short Answer(0)
- True False(0)
- Matching(0)