Exam 2: Organizing and Visualizing Data
Exam 1: Introduction145 Questions
Exam 2: Organizing and Visualizing Data210 Questions
Exam 3: Numerical Descriptive Measures153 Questions
Exam 4: Basic Probability171 Questions
Exam 5: Discrete Probability Distributions218 Questions
Exam 6: The Normal Distribution and Other Continuous Distributions191 Questions
Exam 7: Sampling and Sampling Distributions197 Questions
Exam 8: Confidence Interval Estimation196 Questions
Exam 9: Fundamentals of Hypothesis Testing: One-Sample Tests165 Questions
Exam 10: Two-Sample Tests210 Questions
Exam 11: Analysis of Variance213 Questions
Exam 12: Chi-Square Tests and Nonparametric Tests201 Questions
Exam 13: Simple Linear Regression213 Questions
Exam 14: Introduction to Multiple Regression355 Questions
Exam 15: Multiple Regression Model Building96 Questions
Exam 16: Time-Series Forecasting168 Questions
Exam 17: Statistical Applications in Quality Management133 Questions
Exam 18: A Roadmap for Analyzing Data54 Questions
Exam 19: Questions that Involve Online Topics321 Questions
Select questions type
TABLE 2-7
The Stem-and-Leaf display below contains data on the number of months between the date a civil suit is filed and when the case is actually adjudicated for 50 cases heard in superior court. 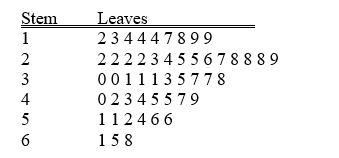 -Referring to Table 2-7,locate the first leaf,i.e.,the lowest valued leaf with the lowest valued stem.This represents a wait of ________ months.
(Short Answer)
4.8/5  (27)
(27)
TABLE 2-8
The Stem-and-Leaf display represents the number of times in a year that a random sample of 100 "lifetime" members of a health club actually visited the facility.
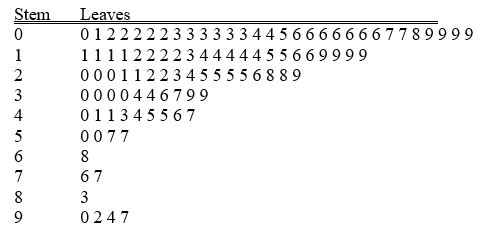 -Referring to Table 2-8,the person who visited the health club less than anyone else in the sample visited the facility ________ times.
(Short Answer)
4.8/5 (37)
TABLE 2-12
The table below contains the opinions of a sample of 200 people broken down by gender about the latest congressional plan to eliminate anti-trust exemptions for professional baseball.
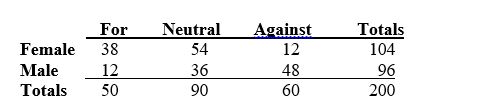 -Referring to Table 2-12,of those neutral in the sample,________ percent were males.
(Short Answer)
4.8/5 (27)
TABLE 2-8
The Stem-and-Leaf display represents the number of times in a year that a random sample of 100 "lifetime" members of a health club actually visited the facility.
-Referring to Table 2-8,________ of the 100 members visited the health club no more than 12 times in a year.
(Short Answer)
4.9/5 (20)
TABLE 2-10
The histogram below represents scores achieved by 200 job applicants on a personality profile.
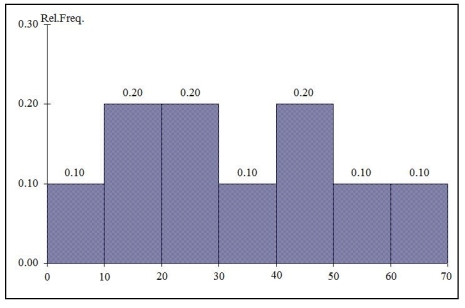 -Referring to the histogram from Table 2-10,________ percent of the applicants scored between 20 and below 50.
(Short Answer)
4.8/5 (29)
TABLE 2-6
A sample of 200 students at a Big-Ten university was taken after the midterm to ask them whether they went bar hopping the weekend before the midterm or spent the weekend studying,and whether they did well or poorly on the midterm.The following table contains the result.
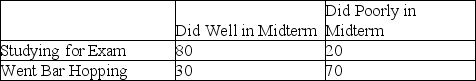 -Referring to Table 2-6,if the sample is a good representation of the population,we can expect ________ percent of those who did poorly on the midterm to have spent the weekend studying.
(Multiple Choice)
4.7/5 (31)
The point halfway between the boundaries of each class interval in a grouped frequency distribution is called the ________.
(Short Answer)
5.0/5 (41)
TABLE 2-11
The ordered array below resulted from selecting a sample of 25 batches of 500 computer chips and determining how many in each batch were defective. 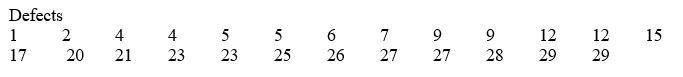 -Referring to Table 2-11,construct a frequency distribution for the defects data,using "0 but less than 5" as the first class.
(Essay)
4.9/5 (41)
TABLE 2-12
The table below contains the opinions of a sample of 200 people broken down by gender about the latest congressional plan to eliminate anti-trust exemptions for professional baseball.
-Referring to Table 2-12,if the sample is a good representation of the population,we can expect ________ percent of the males in the population will be against the plan.
(Short Answer)
4.8/5 (39)
TABLE 2-1
An insurance company evaluates many numerical variables about a person before deciding on an appropriate rate for automobile insurance.A representative from a local insurance agency selected a random sample of insured drivers and recorded,X,the number of claims each made in the last 3 years,with the following results. 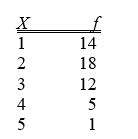 -Referring to Table 2-1,how many total claims are represented in the sample?
(Multiple Choice)
4.8/5 (30)
TABLE 2-14
The table below contains the number of people who own a portable DVD player in a sample of 600 broken down by gender.
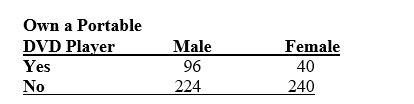 -Referring to Table 2-14,if the sample is a good representation of the population,we can expect ________ percent of the males in the population will own a portable DVD.
(Short Answer)
4.8/5 (35)
The British Airways Internet site provides a questionnaire instrument that can be answered electronically.Which of the 4 methods of data collection is involved when people complete the questionnaire?
(Multiple Choice)
4.7/5 (36)
TABLE 2-6
A sample of 200 students at a Big-Ten university was taken after the midterm to ask them whether they went bar hopping the weekend before the midterm or spent the weekend studying,and whether they did well or poorly on the midterm.The following table contains the result.
-Referring to Table 2-6,if the sample is a good representation of the population,we can expect ________ percent of those who spent the weekend studying to do poorly on the midterm.
(Multiple Choice)
4.8/5 (31)
TABLE 2-5
The following are the duration in minutes of a sample of long-distance phone calls made within the continental United States reported by one long-distance carrier. 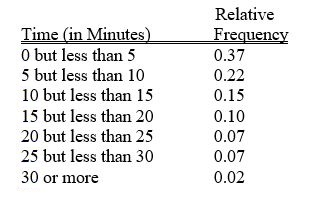 -Referring to Table 2-5,if 10 calls lasted 30 minutes or more,how many calls lasted less than 5 minutes?
(Multiple Choice)
4.8/5 (28)
TABLE 2-5
The following are the duration in minutes of a sample of long-distance phone calls made within the continental United States reported by one long-distance carrier.
-Referring to Table 2-5,if 100 calls were randomly sampled,________ of them would have lasted at least 15 minutes but less than 20 minutes.
(Multiple Choice)
4.9/5 (37)
A study attempted to estimate the proportion of Florida residents who were willing to spend more tax dollars on protecting the beaches from environmental disasters.Twenty-five hundred Florida residents were surveyed.What type of data collection procedure was most likely used to collect the data for this study?
(Multiple Choice)
4.9/5 (44)
TABLE 2-2
At a meeting of information systems officers for regional offices of a national company,a survey was taken to determine the number of employees the officers supervise in the operation of their departments,where X is the number of employees overseen by each information 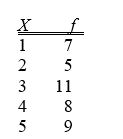 -Referring to Table 2-2,across all of the regional offices,how many total employees were supervised by those surveyed?
(Multiple Choice)
4.8/5 (37)
TABLE 2-8
The Stem-and-Leaf display represents the number of times in a year that a random sample of 100 "lifetime" members of a health club actually visited the facility.
-Referring to Table 2-8,the person who visited the health club more than anyone else in the sample visited the facility ________ times.
(Short Answer)
4.7/5 (35)
TABLE 2-6
A sample of 200 students at a Big-Ten university was taken after the midterm to ask them whether they went bar hopping the weekend before the midterm or spent the weekend studying,and whether they did well or poorly on the midterm.The following table contains the result.
-Referring to Table 2-6,of those who did well on the midterm in the sample,________ percent of them went bar hopping the weekend before the midterm.
(Multiple Choice)
4.8/5 (34)
A good choice for the number of class groups to use in constructing frequency distribution is to have at least 5 but no more than 15 class groups.
(True/False)
4.8/5 (31)
Filters
- Essay(0)
- Multiple Choice(0)
- Short Answer(0)
- True False(0)
- Matching(0)