Exam 2: Organizing and Visualizing Data
Exam 1: Introduction145 Questions
Exam 2: Organizing and Visualizing Data210 Questions
Exam 3: Numerical Descriptive Measures153 Questions
Exam 4: Basic Probability171 Questions
Exam 5: Discrete Probability Distributions218 Questions
Exam 6: The Normal Distribution and Other Continuous Distributions191 Questions
Exam 7: Sampling and Sampling Distributions197 Questions
Exam 8: Confidence Interval Estimation196 Questions
Exam 9: Fundamentals of Hypothesis Testing: One-Sample Tests165 Questions
Exam 10: Two-Sample Tests210 Questions
Exam 11: Analysis of Variance213 Questions
Exam 12: Chi-Square Tests and Nonparametric Tests201 Questions
Exam 13: Simple Linear Regression213 Questions
Exam 14: Introduction to Multiple Regression355 Questions
Exam 15: Multiple Regression Model Building96 Questions
Exam 16: Time-Series Forecasting168 Questions
Exam 17: Statistical Applications in Quality Management133 Questions
Exam 18: A Roadmap for Analyzing Data54 Questions
Exam 19: Questions that Involve Online Topics321 Questions
Select questions type
TABLE 2-8
The Stem-and-Leaf display represents the number of times in a year that a random sample of 100 "lifetime" members of a health club actually visited the facility.
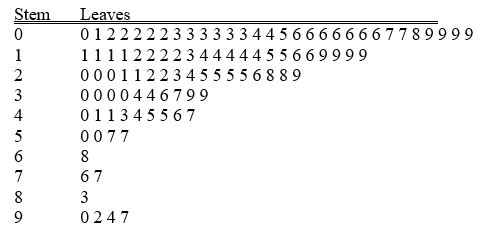 -Referring to Table 2-8,if a frequency distribution with equal sized classes was made from this data,and the first class was "0 but less than 10," the class midpoint of the third class would be ________.
(Short Answer)
4.8/5  (39)
(39)
TABLE 2-5
The following are the duration in minutes of a sample of long-distance phone calls made within the continental United States reported by one long-distance carrier. 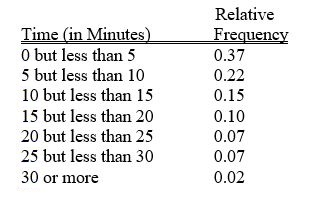 -Referring to Table 2-5,if 1,000 calls were randomly sampled,how many calls lasted under 10 minutes?
(Multiple Choice)
4.9/5 (33)
The width of each class grouping or interval in a frequency distribution should be ________.
(Short Answer)
4.8/5 (32)
Apple Computer,Inc.collected information on the age of their customers.The youngest customer was 12 and the oldest was 72.To study the distribution of the age among its customers,it can use a percentage polygon.
(True/False)
4.9/5 (39)
TABLE 2-13
Given below is the stem-and-leaf display representing the amount of detergent used in gallons (with leaves in tenths of gallons)in a day by 25 drive-through car wash operations in Phoenix.
9 | 1 4 7
10 | 0 2 2 3 8
11 | 1 3 5 5 6 6 7 7 7
12 | 2 2 3 4 8 9
13 | 0 2
-Referring to Table 2-13,if a percentage histogram for the detergent data is constructed,using "9.0 but less than 10.0 gallons" as the first class,what percentage of drive-through car wash operations use less than 12 gallons of detergent in a day?
(Short Answer)
4.8/5 (48)
TABLE 2-16
The figure below is the percentage polygon for the amount of calories for a sample of 36 pizzas products where the upper limits of the intervals are: 310,340,370,400 and 430.
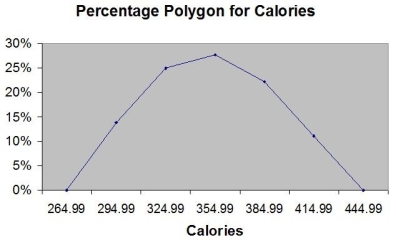 -Referring to Table 2-16,roughly what percentage of pizza products contains between 400 and 430 calories?
(Multiple Choice)
4.7/5 (28)
TABLE 2-13
Given below is the stem-and-leaf display representing the amount of detergent used in gallons (with leaves in tenths of gallons)in a day by 25 drive-through car wash operations in Phoenix.
9 | 1 4 7
10 | 0 2 2 3 8
11 | 1 3 5 5 6 6 7 7 7
12 | 2 2 3 4 8 9
13 | 0 2
-Referring to Table 2-13,construct a percentage polygon for the detergent data if the corresponding frequency distribution uses "9.0 but less than 10.0" as the first class.
(Essay)
4.7/5 (29)
TABLE 2-5
The following are the duration in minutes of a sample of long-distance phone calls made within the continental United States reported by one long-distance carrier.
-Referring to Table 2-5,if 100 calls were sampled,________ of them would have lasted less than 15 minutes.
(Multiple Choice)
4.8/5 (36)
A statistics student found a reference in the campus library that contained the median family incomes for all 50 states.She would report her data as being collected using
(Multiple Choice)
4.8/5 (35)
TABLE 2-7
The Stem-and-Leaf display below contains data on the number of months between the date a civil suit is filed and when the case is actually adjudicated for 50 cases heard in superior court. 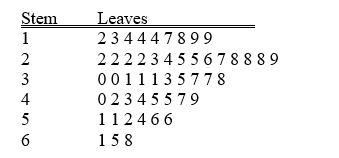 -Referring to Table 2-7,the civil suit with the longest wait between when the suit was filed and when it was adjudicated had a wait of ________ months.
(Short Answer)
4.8/5 (32)
TABLE 2-14
The table below contains the number of people who own a portable DVD player in a sample of 600 broken down by gender.
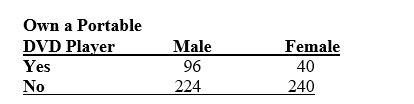 -Referring to Table 2-14,if the sample is a good representation of the population,we can expect ________ percent of the females in the population will not own a portable DVD.
(Short Answer)
4.9/5 (40)
TABLE 2-6
A sample of 200 students at a Big-Ten university was taken after the midterm to ask them whether they went bar hopping the weekend before the midterm or spent the weekend studying,and whether they did well or poorly on the midterm.The following table contains the result.
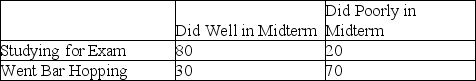 -Referring to Table 2-6,of those who went bar hopping the weekend before the midterm in the sample,________ percent of them did well on the midterm.
(Multiple Choice)
4.9/5 (26)
TABLE 2-2
At a meeting of information systems officers for regional offices of a national company,a survey was taken to determine the number of employees the officers supervise in the operation of their departments,where X is the number of employees overseen by each information 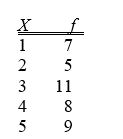 -The width of each bar in a histogram corresponds to the
(Multiple Choice)
4.7/5 (31)
Jared was working on a project to look at global warming and accessed an Internet site where he captured average global surface temperatures from 1866.Which of the four methods of data collection was he using?
(Multiple Choice)
4.9/5 (36)
TABLE 2-17
The following table presents total retail sales in millions of dollars for the leading apparel companies during April 2009 and April 2010.
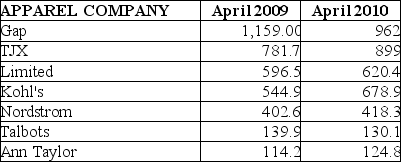 -Referring to Table 2-17,among the 8 stores,________ saw a sales decline.
(Short Answer)
4.8/5 (26)
The sum of cumulative frequencies in a distribution always equals 1.
(True/False)
4.8/5 (32)
TABLE 2-10
The histogram below represents scores achieved by 200 job applicants on a personality profile.
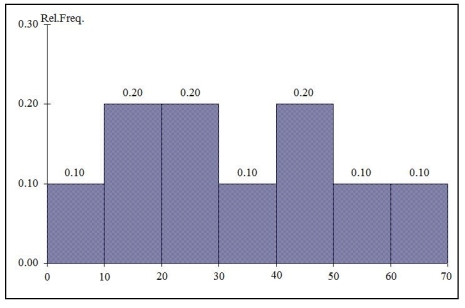 -Referring to the histogram from Table 2-10,________ percent of the job applicants scored below 50.
(Short Answer)
4.8/5 (33)
TABLE 2-10
The histogram below represents scores achieved by 200 job applicants on a personality profile.
-Referring to the histogram from Table 2-10,90% of the job applicants scored above or equal to ________.
(Short Answer)
4.9/5 (34)
TABLE 2-13
Given below is the stem-and-leaf display representing the amount of detergent used in gallons (with leaves in tenths of gallons)in a day by 25 drive-through car wash operations in Phoenix.
9 | 1 4 7
10 | 0 2 2 3 8
11 | 1 3 5 5 6 6 7 7 7
12 | 2 2 3 4 8 9
13 | 0 2
-Referring to Table 2-13,if a relative frequency or percentage distribution for the detergent data is constructed,using "9.0 but less than 10.0 gallons" as the first class,what percentage of drive-through car wash operations use at least 10 gallons but less than 13 gallons of detergent in a day?
(Short Answer)
4.9/5 (32)
Filters
- Essay(0)
- Multiple Choice(0)
- Short Answer(0)
- True False(0)
- Matching(0)