Exam 2: Organizing and Visualizing Data
Exam 1: Introduction145 Questions
Exam 2: Organizing and Visualizing Data210 Questions
Exam 3: Numerical Descriptive Measures153 Questions
Exam 4: Basic Probability171 Questions
Exam 5: Discrete Probability Distributions218 Questions
Exam 6: The Normal Distribution and Other Continuous Distributions191 Questions
Exam 7: Sampling and Sampling Distributions197 Questions
Exam 8: Confidence Interval Estimation196 Questions
Exam 9: Fundamentals of Hypothesis Testing: One-Sample Tests165 Questions
Exam 10: Two-Sample Tests210 Questions
Exam 11: Analysis of Variance213 Questions
Exam 12: Chi-Square Tests and Nonparametric Tests201 Questions
Exam 13: Simple Linear Regression213 Questions
Exam 14: Introduction to Multiple Regression355 Questions
Exam 15: Multiple Regression Model Building96 Questions
Exam 16: Time-Series Forecasting168 Questions
Exam 17: Statistical Applications in Quality Management133 Questions
Exam 18: A Roadmap for Analyzing Data54 Questions
Exam 19: Questions that Involve Online Topics321 Questions
Select questions type
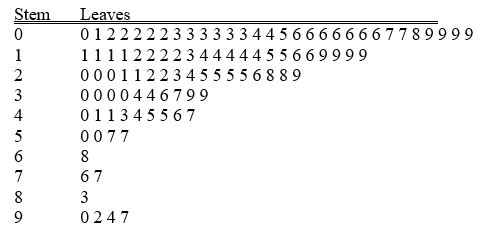
TABLE 2-18
The stem-and-leaf display below shows the result of a survey on 50 students on their satisfaction with their school with the higher scores represent higher level of satisfaction.
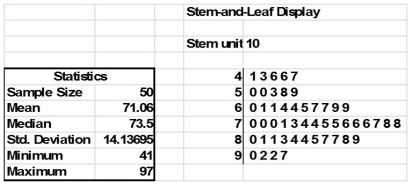 -Referring to Table 2-18,if a student is randomly selected,his/her most likely level of satisfaction will be in the 70s among the 40s,50s,60s,70s,80s and 90s.
(True/False)
4.9/5  (43)
(43)
TABLE 2-12
The table below contains the opinions of a sample of 200 people broken down by gender about the latest congressional plan to eliminate anti-trust exemptions for professional baseball.
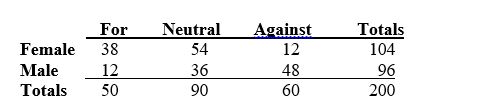 -Referring to Table 2-12,________ percent of the 200 were females who were either neutral or against the plan.
(Short Answer)
4.8/5 (33)
You have collected data on the number of U.S.households actively using online banking and/or online bill payment from 1995 to 2010.Which of the following is the best for presenting the data?
(Multiple Choice)
4.9/5 (45)
TABLE 2-14
The table below contains the number of people who own a portable DVD player in a sample of 600 broken down by gender.
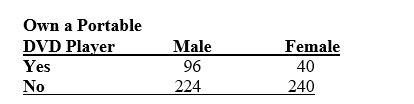 -Referring to Table 2-14,if the sample is a good representation of the population,we can expect ________ percent of those who own a portable DVD in the population will be males.
(Short Answer)
4.7/5 (33)
TABLE 2-12
The table below contains the opinions of a sample of 200 people broken down by gender about the latest congressional plan to eliminate anti-trust exemptions for professional baseball.
-Referring to Table 2-12,________ percent of the 200 were males.
(Short Answer)
4.9/5 (31)
TABLE 2-5
The following are the duration in minutes of a sample of long-distance phone calls made within the continental United States reported by one long-distance carrier. 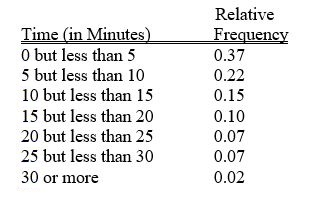 -Referring to Table 2-5,what is the width of each class?
(Multiple Choice)
4.8/5 (36)
To determine the width of class interval,divide the number of class groups by the range of the data.
(True/False)
4.8/5 (37)
TABLE 2-14
The table below contains the number of people who own a portable DVD player in a sample of 600 broken down by gender.
-Referring to Table 2-14,________ percent of the 600 were males who did not own a portable DVD.
(Short Answer)
4.9/5 (33)
TABLE 2-8
The Stem-and-Leaf display represents the number of times in a year that a random sample of 100 "lifetime" members of a health club actually visited the facility.
 -Referring to Table 2-8,the person who has the largest leaf associated with the smallest stem visited the facility ________ times.
(Short Answer)
4.8/5 (31)
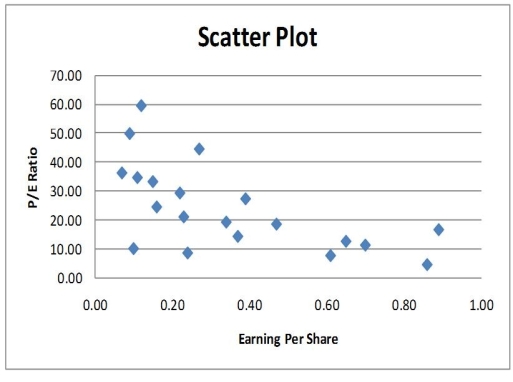
Given below is the scatter plot of the price/earnings ratio versus earnings per share of 20 U.S.companies.There appears to be a negative relationship between price/earnings ratio and earnings per share.
(True/False)
4.9/5 (34)
TABLE 2-9
The frequency distribution below represents the rents of 250 randomly selected federally subsidized apartments in a small town. 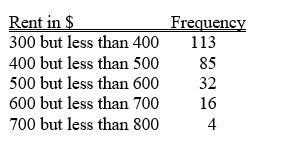 -Referring to Table 2-9,________ percent of the apartments rented for at least $500.
(Short Answer)
4.9/5 (41)
The main principle behind the Pareto chart is the ability to separate the "vital few" from the "trivial many."
(True/False)
4.9/5 (30)
TABLE 2-8
The Stem-and-Leaf display represents the number of times in a year that a random sample of 100 "lifetime" members of a health club actually visited the facility.
-Referring to Table 2-8,if a frequency distribution with equal sized classes was made from this data,and the first class was "0 but less than 10," the relative frequency of the last class would be ________.
(Short Answer)
4.8/5 (45)
If the values of the seventh and eighth class in a cumulative percentage distribution are the same,we know that there are no observations in the eighth class.
(True/False)
4.8/5 (44)
TABLE 2-12
The table below contains the opinions of a sample of 200 people broken down by gender about the latest congressional plan to eliminate anti-trust exemptions for professional baseball.
-Referring to Table 2-12,________ percent of the 200 were males who were neutral.
(Short Answer)
4.8/5 (35)
Which of the 4 methods of data collection is involved when a person counts the number of cars passing designated locations on the Los Angeles freeway system?
(Multiple Choice)
4.9/5 (37)
TABLE 2-12
The table below contains the opinions of a sample of 200 people broken down by gender about the latest congressional plan to eliminate anti-trust exemptions for professional baseball.
-Referring to Table 2-12,if the sample is a good representation of the population,we can expect ________ percent of those for the plan in the population will be males.
(Short Answer)
4.9/5 (40)
TABLE 2-9
The frequency distribution below represents the rents of 250 randomly selected federally subsidized apartments in a small town.
-Referring to Table 2-9,________ apartments rented for at least $400 but less than $600.
(Short Answer)
4.8/5 (34)
TABLE 2-18
The stem-and-leaf display below shows the result of a survey on 50 students on their satisfaction with their school with the higher scores represent higher level of satisfaction.
-Referring to Table 2-18,if a student is randomly selected,his/her most likely level of satisfaction will be in the 60s among the 40s,50s,60s,70s,80s and 90s.
(True/False)
4.8/5 (41)
TABLE 2-13
Given below is the stem-and-leaf display representing the amount of detergent used in gallons (with leaves in tenths of gallons)in a day by 25 drive-through car wash operations in Phoenix.
9 | 1 4 7
10 | 0 2 2 3 8
11 | 1 3 5 5 6 6 7 7 7
12 | 2 2 3 4 8 9
13 | 0 2
-Referring to Table 2-13,if a percentage histogram for the detergent data is constructed,using "9.0 but less than 10.0 gallons" as the first class,the percentage of drive-through car wash operations that use "12.0 but less than 13.0 gallons" of detergent would be ________.
(Short Answer)
4.8/5 (31)
Filters
- Essay(0)
- Multiple Choice(0)
- Short Answer(0)
- True False(0)
- Matching(0)