Exam 2: Organizing and Visualizing Data
Exam 1: Introduction145 Questions
Exam 2: Organizing and Visualizing Data210 Questions
Exam 3: Numerical Descriptive Measures153 Questions
Exam 4: Basic Probability171 Questions
Exam 5: Discrete Probability Distributions218 Questions
Exam 6: The Normal Distribution and Other Continuous Distributions191 Questions
Exam 7: Sampling and Sampling Distributions197 Questions
Exam 8: Confidence Interval Estimation196 Questions
Exam 9: Fundamentals of Hypothesis Testing: One-Sample Tests165 Questions
Exam 10: Two-Sample Tests210 Questions
Exam 11: Analysis of Variance213 Questions
Exam 12: Chi-Square Tests and Nonparametric Tests201 Questions
Exam 13: Simple Linear Regression213 Questions
Exam 14: Introduction to Multiple Regression355 Questions
Exam 15: Multiple Regression Model Building96 Questions
Exam 16: Time-Series Forecasting168 Questions
Exam 17: Statistical Applications in Quality Management133 Questions
Exam 18: A Roadmap for Analyzing Data54 Questions
Exam 19: Questions that Involve Online Topics321 Questions
Select questions type
Given below is the scatter plot of the number of employees and the total revenue ($millions)of 20 U.S.companies.Companies that have higher numbers of employees appear to also have higher total revenue.
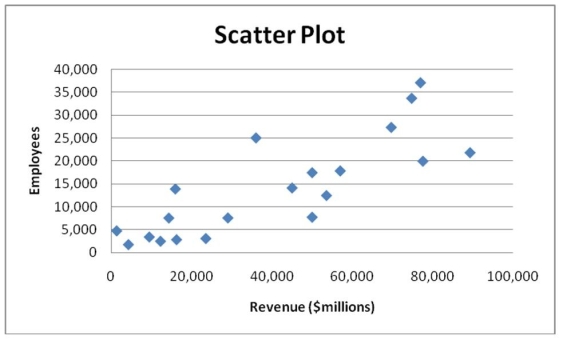
(True/False)
4.8/5  (42)
(42)
You have collected data on the approximate retail price (in $)and the energy cost per year (in $)of 15 refrigerators.Which of the following is the best for presenting the data?
(Multiple Choice)
4.8/5 (34)
TABLE 2-14
The table below contains the number of people who own a portable DVD player in a sample of 600 broken down by gender.
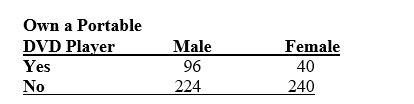 -Referring to Table 2-14,construct a table of total percentages.
(Essay)
4.7/5 (36)
When studying the simultaneous responses to two categorical questions,you should set up a
(Multiple Choice)
4.9/5 (40)
TABLE 2-2
At a meeting of information systems officers for regional offices of a national company,a survey was taken to determine the number of employees the officers supervise in the operation of their departments,where X is the number of employees overseen by each information 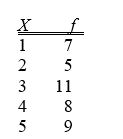 -Referring to Table 2-2,how many regional offices are represented in the survey results?
(Multiple Choice)
4.9/5 (33)
TABLE 2-8
The Stem-and-Leaf display represents the number of times in a year that a random sample of 100 "lifetime" members of a health club actually visited the facility.
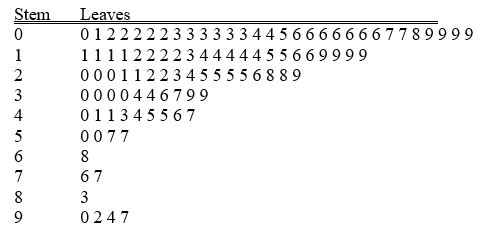 -Referring to Table 2-8,________ of the 100 members visited the health club at least 52 times in a year.
(Short Answer)
4.7/5 (35)
You have collected information on the market share of 5 different search engines used by U.S.Internet users in January 2011.Which of the following is the best for presenting the information?
(Multiple Choice)
4.8/5 (38)
Histograms are used for numerical data while bar charts are suitable for categorical data.
(True/False)
5.0/5 (32)
Given below is the scatter plot of the market value (thousands$)and profit (thousands$)of 50 U.S.companies.Higher market values appear to be associated with higher profits.
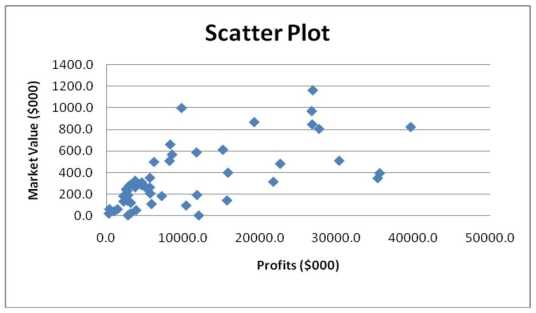
(True/False)
5.0/5 (27)
The stem-and-leaf display is often superior to the frequency distribution in that it maintains the original values for further analysis.
(True/False)
4.8/5 (42)
A histogram can have gaps between the bars,whereas bar charts cannot have gaps.
(True/False)
4.7/5 (35)
TABLE 2-11
The ordered array below resulted from selecting a sample of 25 batches of 500 computer chips and determining how many in each batch were defective. 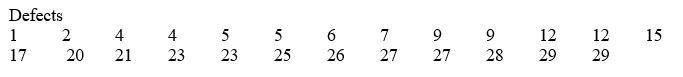 -Referring to Table 2-11,construct a histogram for the defects data,using "0 but less than 5" as the first class.
(Essay)
4.8/5 (39)
You have collected data on the number of complaints for 6 different brands of automobiles sold in the US in 2006 and in 2010.Which of the following is the best for presenting the data?
(Multiple Choice)
4.8/5 (29)
TABLE 2-8
The Stem-and-Leaf display represents the number of times in a year that a random sample of 100 "lifetime" members of a health club actually visited the facility.
-Referring to Table 2-8,if a frequency distribution with equal sized classes was made from this data,and the first class was "0 but less than 10," the cumulative percentage of the next-to-last class would be ________.
(Short Answer)
4.8/5 (42)
TABLE 2-11
The ordered array below resulted from selecting a sample of 25 batches of 500 computer chips and determining how many in each batch were defective.
-Referring to Table 2-11,construct a cumulative percentage distribution for the defects data if the corresponding frequency distribution uses "0 but less than 5" as the first class.
(Essay)
4.8/5 (33)
The sum of relative frequencies in a distribution always equals 1.
(True/False)
4.8/5 (27)
TABLE 2-16
The figure below is the percentage polygon for the amount of calories for a sample of 36 pizzas products where the upper limits of the intervals are: 310,340,370,400 and 430.
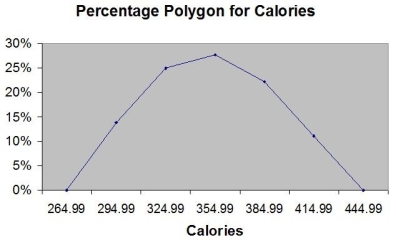 -Referring to Table 2-16,roughly what percentage of pizza products contains at least 340 calories?
(Multiple Choice)
4.8/5 (28)
Which of the following is appropriate for displaying data collected on the different brands of cars students at a major university drive?
(Multiple Choice)
4.8/5 (35)
TABLE 2-4
A survey was conducted to determine how people rated the quality of programming available on television.Respondents were asked to rate the overall quality from 0 (no quality at all)to 100 (extremely good quality).The stem-and-leaf display of the data is shown below. 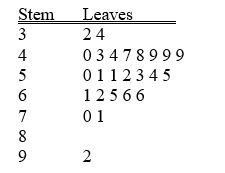 -Referring to Table 2-4,what percentage of the respondents rated overall television quality with a rating of 80 or above?
(Multiple Choice)
4.7/5 (32)
Filters
- Essay(0)
- Multiple Choice(0)
- Short Answer(0)
- True False(0)
- Matching(0)