Exam 2: Organizing and Visualizing Data
Exam 1: Introduction145 Questions
Exam 2: Organizing and Visualizing Data210 Questions
Exam 3: Numerical Descriptive Measures153 Questions
Exam 4: Basic Probability171 Questions
Exam 5: Discrete Probability Distributions218 Questions
Exam 6: The Normal Distribution and Other Continuous Distributions191 Questions
Exam 7: Sampling and Sampling Distributions197 Questions
Exam 8: Confidence Interval Estimation196 Questions
Exam 9: Fundamentals of Hypothesis Testing: One-Sample Tests165 Questions
Exam 10: Two-Sample Tests210 Questions
Exam 11: Analysis of Variance213 Questions
Exam 12: Chi-Square Tests and Nonparametric Tests201 Questions
Exam 13: Simple Linear Regression213 Questions
Exam 14: Introduction to Multiple Regression355 Questions
Exam 15: Multiple Regression Model Building96 Questions
Exam 16: Time-Series Forecasting168 Questions
Exam 17: Statistical Applications in Quality Management133 Questions
Exam 18: A Roadmap for Analyzing Data54 Questions
Exam 19: Questions that Involve Online Topics321 Questions
Select questions type
TABLE 2-6
A sample of 200 students at a Big-Ten university was taken after the midterm to ask them whether they went bar hopping the weekend before the midterm or spent the weekend studying,and whether they did well or poorly on the midterm.The following table contains the result.
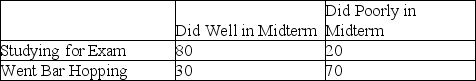 -Referring to Table 2-6,________ percent of the students in the sample spent the weekend studying and did well on the midterm.
(Multiple Choice)
4.8/5  (31)
(31)
In graphing two categorical data,the side-by-side bar chart is best suited when comparing joint responses.
(True/False)
4.8/5 (41)
TABLE 2-14
The table below contains the number of people who own a portable DVD player in a sample of 600 broken down by gender.
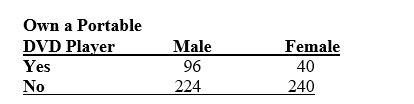 -Referring to Table 2-14,if the sample is a good representation of the population,we can expect ________ percent of the population will be males.
(Short Answer)
4.8/5 (30)
TABLE 2-12
The table below contains the opinions of a sample of 200 people broken down by gender about the latest congressional plan to eliminate anti-trust exemptions for professional baseball.
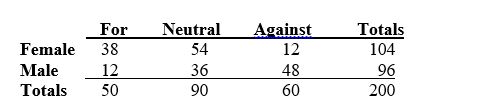 -Referring to Table 2-12,if the sample is a good representation of the population,we can expect ________ percent of the females in the population will not be against the plan.
(Short Answer)
4.9/5 (25)
TABLE 2-13
Given below is the stem-and-leaf display representing the amount of detergent used in gallons (with leaves in tenths of gallons)in a day by 25 drive-through car wash operations in Phoenix.
9 | 1 4 7
10 | 0 2 2 3 8
11 | 1 3 5 5 6 6 7 7 7
12 | 2 2 3 4 8 9
13 | 0 2
-Referring to Table 2-13,construct a cumulative percentage distribution for the detergent data if the corresponding frequency distribution uses "9.0 but less than 10.0" as the first class.
(Essay)
4.8/5 (29)
TABLE 2-14
The table below contains the number of people who own a portable DVD player in a sample of 600 broken down by gender.
-Referring to Table 2-14,construct a table of column percentages.
(Essay)
4.8/5 (36)
TABLE 2-15
The figure below is the ogive for the amount of fat (in grams)for a sample of 36 pizza products where the upper boundaries of the intervals are: 5,10,15,20,25,and 30.
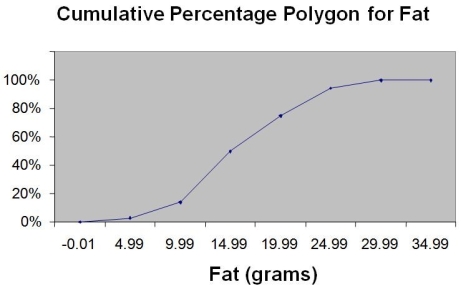 -Referring to Table 2-15,what percentage of pizza products contains between 10 and 25 grams of fat?
(Multiple Choice)
4.9/5 (31)
TABLE 2-15
The figure below is the ogive for the amount of fat (in grams)for a sample of 36 pizza products where the upper boundaries of the intervals are: 5,10,15,20,25,and 30.
-Referring to Table 2-15,roughly what percentage of pizza products contains less than 10 grams of fat?
(Multiple Choice)
4.9/5 (35)
TABLE 2-12
The table below contains the opinions of a sample of 200 people broken down by gender about the latest congressional plan to eliminate anti-trust exemptions for professional baseball.
-Referring to Table 2-12,if the sample is a good representation of the population,we can expect ________ percent of the population will be for the plant.
(Short Answer)
4.9/5 (35)
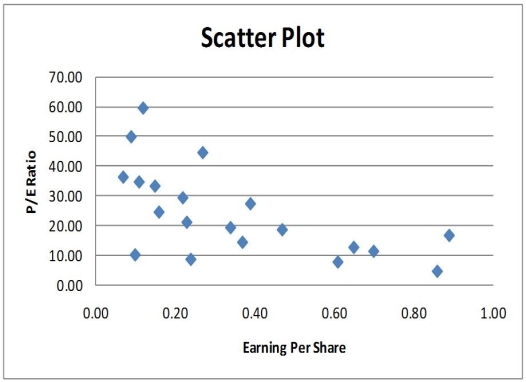
Given below is the scatter plot of the price/earnings ratio versus earnings per share of 20 U.S.companies.There appear to be a positive relationship between price/earnings ratio and earnings per share.
(True/False)
4.8/5 (32)
TABLE 2-5
The following are the duration in minutes of a sample of long-distance phone calls made within the continental United States reported by one long-distance carrier. 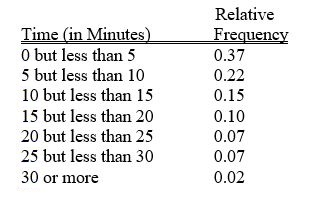 -Referring to Table 2-5,if 100 calls were sampled,________ of them would have lasted 20 minutes or more.
(Multiple Choice)
4.8/5 (38)
You have collected information on the consumption by the 15 largest coffee-consuming nations.Which of the following is the best for presenting the shares of the consumption?
(Multiple Choice)
4.9/5 (41)
Apple Computer,Inc.collected information on the age of their customers.The youngest customer was 12 and the oldest was 72.To study the distribution of the age among its customers,it can use a Pareto chart.
(True/False)
4.9/5 (38)
TABLE 2-10
The histogram below represents scores achieved by 200 job applicants on a personality profile.
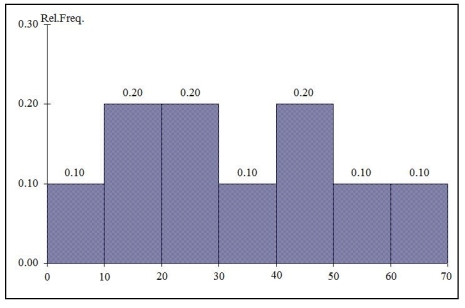 -Referring to the histogram from Table 2-10,the number of job applicants who scored between 30 and below 60 is ________.
(Short Answer)
5.0/5 (37)
In general,a frequency distribution should have at least 8 class groups but no more than 20.
(True/False)
4.9/5 (41)
TABLE 2-9
The frequency distribution below represents the rents of 250 randomly selected federally subsidized apartments in a small town. 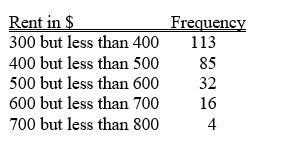 -Referring to Table 2-9,the relative frequency of the second class is ________.
(Short Answer)
4.8/5 (43)
TABLE 2-12
The table below contains the opinions of a sample of 200 people broken down by gender about the latest congressional plan to eliminate anti-trust exemptions for professional baseball.
-Referring to Table 2-12,of those for the plan in the sample,________ percent were females.
(Short Answer)
4.8/5 (37)
TABLE 2-14
The table below contains the number of people who own a portable DVD player in a sample of 600 broken down by gender.
-Referring to Table 2-14,________ percent of the 600 were females who either owned or did not own a portable DVD.
(Short Answer)
4.8/5 (32)
Data on the number of credit hours of 20,000 students at a public university enrolled in a spring semester were collected.Which of the following is the best for presenting the information?
(Multiple Choice)
4.8/5 (31)
TABLE 2-13
Given below is the stem-and-leaf display representing the amount of detergent used in gallons (with leaves in tenths of gallons)in a day by 25 drive-through car wash operations in Phoenix.
9 | 1 4 7
10 | 0 2 2 3 8
11 | 1 3 5 5 6 6 7 7 7
12 | 2 2 3 4 8 9
13 | 0 2
-Referring to Table 2-13,construct a cumulative percentage polygon for the detergent data if the corresponding frequency distribution uses "9.0 but less than 10.0" as the first class.
(Essay)
4.9/5 (34)
Filters
- Essay(0)
- Multiple Choice(0)
- Short Answer(0)
- True False(0)
- Matching(0)