Exam 2: Organizing and Visualizing Data
Exam 1: Introduction145 Questions
Exam 2: Organizing and Visualizing Data210 Questions
Exam 3: Numerical Descriptive Measures153 Questions
Exam 4: Basic Probability171 Questions
Exam 5: Discrete Probability Distributions218 Questions
Exam 6: The Normal Distribution and Other Continuous Distributions191 Questions
Exam 7: Sampling and Sampling Distributions197 Questions
Exam 8: Confidence Interval Estimation196 Questions
Exam 9: Fundamentals of Hypothesis Testing: One-Sample Tests165 Questions
Exam 10: Two-Sample Tests210 Questions
Exam 11: Analysis of Variance213 Questions
Exam 12: Chi-Square Tests and Nonparametric Tests201 Questions
Exam 13: Simple Linear Regression213 Questions
Exam 14: Introduction to Multiple Regression355 Questions
Exam 15: Multiple Regression Model Building96 Questions
Exam 16: Time-Series Forecasting168 Questions
Exam 17: Statistical Applications in Quality Management133 Questions
Exam 18: A Roadmap for Analyzing Data54 Questions
Exam 19: Questions that Involve Online Topics321 Questions
Select questions type
One of the advantages of a pie chart is that it clearly shows that the total of all the categories of the pie adds to 100%.
(True/False)
4.8/5  (31)
(31)
TABLE 2-18
The stem-and-leaf display below shows the result of a survey on 50 students on their satisfaction with their school with the higher scores represent higher level of satisfaction.
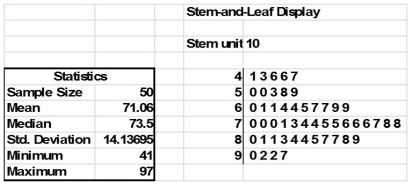 -Referring to Table 2-18,how many students have a satisfaction level of at least 80?
(Short Answer)
4.9/5 (40)
In general,grouped frequency distributions should have between 5 and 15 class intervals.
(True/False)
4.9/5 (33)
TABLE 2-4
A survey was conducted to determine how people rated the quality of programming available on television.Respondents were asked to rate the overall quality from 0 (no quality at all)to 100 (extremely good quality).The stem-and-leaf display of the data is shown below. 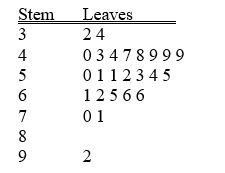 -Referring to Table 2-4,what percentage of the respondents rated overall television quality with a rating of 50 or below?
(Multiple Choice)
4.8/5 (31)
TABLE 2-17
The following table presents total retail sales in millions of dollars for the leading apparel companies during April 2009 and April 2010.
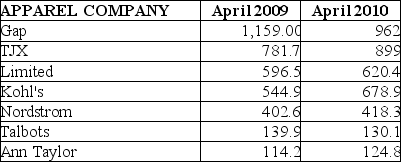 -Referring to Table 2-17,construct a side-by-side bar chart.
(Essay)
4.7/5 (34)
When constructing a frequency distribution,classes should be selected so that they are of equal width.
(True/False)
4.7/5 (31)
TABLE 2-10
The histogram below represents scores achieved by 200 job applicants on a personality profile.
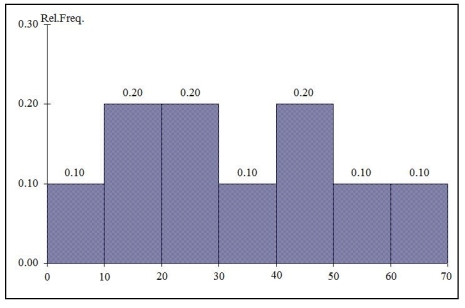 -Referring to the histogram from Table 2-10,the number of job applicants who scored 50 or above is ________.
(Short Answer)
4.9/5 (38)
You have collected data on the monthly seasonally adjusted civilian unemployment rate for the United States from 1998 to 2010.Which of the following is the best for presenting the data?
(Multiple Choice)
4.8/5 (31)
A research analyst was directed to arrange raw data collected on the yield of wheat,ranging from 40 to 93 bushels per acre,in a frequency distribution.He should choose 30 as the class interval width.
(True/False)
4.7/5 (37)
Tim was planning for a meeting with his boss to discuss a raise in his annual salary.In preparation,he wanted to use the Consumer Price Index to determine the percentage increase in his real (inflation-adjusted)salary over the last three years.Which of the 4 methods of data collection was involved when he used the Consumer Price Index?
(Multiple Choice)
4.9/5 (30)
TABLE 2-15
The figure below is the ogive for the amount of fat (in grams)for a sample of 36 pizza products where the upper boundaries of the intervals are: 5,10,15,20,25,and 30.
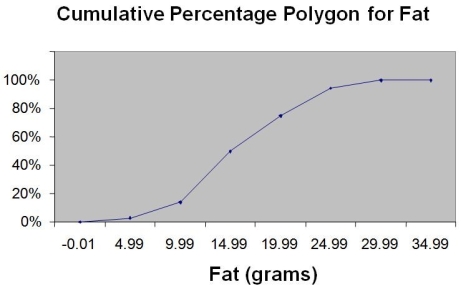 -Referring to Table 2-15,what percentage of pizza products contains at least 20 grams of fat?
(Multiple Choice)
5.0/5 (29)
Percentage polygons are plotted at the boundaries of the class groupings.
(True/False)
4.8/5 (33)
In order to compare one large set of numerical data to another,a ________ distribution must be developed from the frequency distribution.
(Essay)
5.0/5 (42)
TABLE 2-12
The table below contains the opinions of a sample of 200 people broken down by gender about the latest congressional plan to eliminate anti-trust exemptions for professional baseball.
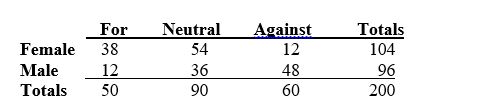 -Referring to Table 2-12,construct a table of row percentages.
(Essay)
4.9/5 (35)
One of the developing countries is experiencing a baby boom,with the number of births rising for the fifth year in a row,according to a BBC News report.Which of the following is best for displaying this data?
(Multiple Choice)
5.0/5 (34)
TABLE 2-13
Given below is the stem-and-leaf display representing the amount of detergent used in gallons (with leaves in tenths of gallons)in a day by 25 drive-through car wash operations in Phoenix.
9 | 1 4 7
10 | 0 2 2 3 8
11 | 1 3 5 5 6 6 7 7 7
12 | 2 2 3 4 8 9
13 | 0 2
-Referring to Table 2-13,if a relative frequency or percentage distribution for the detergent data is constructed,using "9.0 but less than 10.0 gallons" as the first class,what percentage of drive-through car wash operations use at least 10 gallons of detergent in a day?
(Short Answer)
4.7/5 (31)
TABLE 2-14
The table below contains the number of people who own a portable DVD player in a sample of 600 broken down by gender.
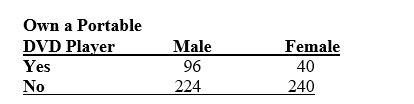 -Referring to Table 2-14,________ percent of the 600 were males who owned a portable DVD.
(Short Answer)
4.9/5 (41)
The personnel director at a large company studied the eating habits of the company's employees.The director noted whether employees brought their own lunches to work,ate at the company cafeteria,or went out to lunch.The goal of the study was to improve the food service at the company cafeteria.This type of data collection would best be considered as
(Multiple Choice)
4.7/5 (42)
TABLE 2-7
The Stem-and-Leaf display below contains data on the number of months between the date a civil suit is filed and when the case is actually adjudicated for 50 cases heard in superior court. 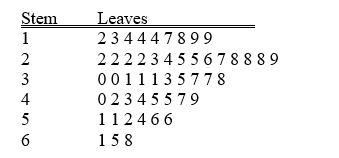 -Referring to Table 2-7,if a frequency distribution with equal sized classes was made from this data,and the first class was "10 but less than 20," the relative frequency of the third class would be ________.
(Short Answer)
5.0/5 (32)
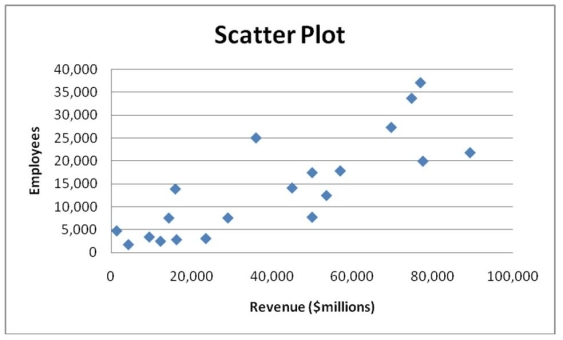
Given below is the scatter plot of the number of employees and the total revenue ($millions)of 20 U.S.companies.There appears to be a positive relationship between total revenue and the number of employees.
(True/False)
4.8/5 (34)
Filters
- Essay(0)
- Multiple Choice(0)
- Short Answer(0)
- True False(0)
- Matching(0)