Exam 2: Organizing and Visualizing Data
Exam 1: Introduction145 Questions
Exam 2: Organizing and Visualizing Data210 Questions
Exam 3: Numerical Descriptive Measures153 Questions
Exam 4: Basic Probability171 Questions
Exam 5: Discrete Probability Distributions218 Questions
Exam 6: The Normal Distribution and Other Continuous Distributions191 Questions
Exam 7: Sampling and Sampling Distributions197 Questions
Exam 8: Confidence Interval Estimation196 Questions
Exam 9: Fundamentals of Hypothesis Testing: One-Sample Tests165 Questions
Exam 10: Two-Sample Tests210 Questions
Exam 11: Analysis of Variance213 Questions
Exam 12: Chi-Square Tests and Nonparametric Tests201 Questions
Exam 13: Simple Linear Regression213 Questions
Exam 14: Introduction to Multiple Regression355 Questions
Exam 15: Multiple Regression Model Building96 Questions
Exam 16: Time-Series Forecasting168 Questions
Exam 17: Statistical Applications in Quality Management133 Questions
Exam 18: A Roadmap for Analyzing Data54 Questions
Exam 19: Questions that Involve Online Topics321 Questions
Select questions type
TABLE 2-14
The table below contains the number of people who own a portable DVD player in a sample of 600 broken down by gender.
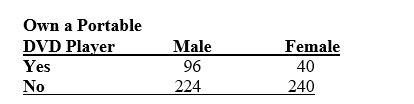 -Referring to Table 2-14,________ percent of the 600 were females who owned a portable DVD.
(Short Answer)
4.9/5  (45)
(45)
TABLE 2-13
Given below is the stem-and-leaf display representing the amount of detergent used in gallons (with leaves in tenths of gallons)in a day by 25 drive-through car wash operations in Phoenix.
9 | 1 4 7
10 | 0 2 2 3 8
11 | 1 3 5 5 6 6 7 7 7
12 | 2 2 3 4 8 9
13 | 0 2
-Referring to Table 2-13,construct a relative frequency or percentage distribution for the detergent data,using "9.0 but less than 10.0" as the first class.
(Essay)
4.8/5 (46)
When comparing two or more large sets of numerical data,the distributions being developed should use the same ________.
(Short Answer)
4.8/5 (32)
The percentage distribution cannot be constructed from the frequency distribution directly.
(True/False)
4.7/5 (39)
The larger the number of observations in a numerical data set,the larger the number of class intervals needed for a grouped frequency distribution.
(True/False)
4.8/5 (35)
TABLE 2-11
The ordered array below resulted from selecting a sample of 25 batches of 500 computer chips and determining how many in each batch were defective. 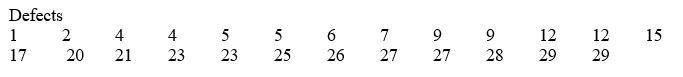 -Referring to Table 2-11,if a frequency distribution for the defects data is constructed,using "0 but less than 5" as the first class,the frequency of the "20 but less than 25" class would be ________.
(Short Answer)
4.8/5 (33)
TABLE 2-12
The table below contains the opinions of a sample of 200 people broken down by gender about the latest congressional plan to eliminate anti-trust exemptions for professional baseball.
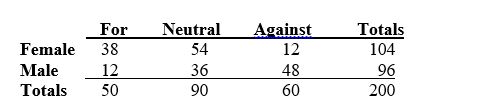 -Referring to Table 2-12,________ percent of the 200 were males who were not against the plan.
(Short Answer)
5.0/5 (39)
TABLE 2-5
The following are the duration in minutes of a sample of long-distance phone calls made within the continental United States reported by one long-distance carrier. 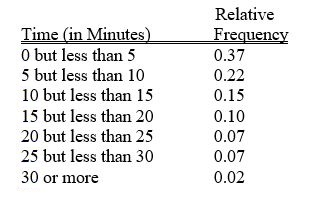 -Referring to Table 2-5,what is the cumulative relative frequency for the percentage of calls that lasted 10 minutes or more?
(Multiple Choice)
4.7/5 (43)
When constructing charts,the following is plotted at the class midpoints:
(Multiple Choice)
4.8/5 (22)
Filters
- Essay(0)
- Multiple Choice(0)
- Short Answer(0)
- True False(0)
- Matching(0)