Exam 16: Time-Series Forecasting
Exam 1: Defining and Collecting Data207 Questions
Exam 2: Organizing and Visualizing Variables213 Questions
Exam 3: Numerical Descriptive Measures167 Questions
Exam 4: Basic Probability171 Questions
Exam 5: Discrete Probability Distributions217 Questions
Exam 6: The Normal Distributions and Other Continuous Distributions189 Questions
Exam 7: Sampling Distributions135 Questions
Exam 8: Confidence Interval Estimation189 Questions
Exam 9: Fundamentals of Hypothesis Testing: One-Sample Tests187 Questions
Exam 10: Two-Sample Tests208 Questions
Exam 11: Analysis of Variance216 Questions
Exam 12: Chi-Square and Nonparametric Tests178 Questions
Exam 13: Simple Linear Regression214 Questions
Exam 14: Introduction to Multiple Regression336 Questions
Exam 15: Multiple Regression Model Building99 Questions
Exam 16: Time-Series Forecasting173 Questions
Exam 17: Business Analytics115 Questions
Exam 18: A Roadmap for Analyzing Data329 Questions
Exam 19: Statistical Applications in Quality Management Online162 Questions
Exam 20: Decision Making Online129 Questions
Exam 21: Understanding Statistics: Descriptive and Inferential Techniques39 Questions
Select questions type
Which of the following statements about moving averages is not true?
(Multiple Choice)
4.8/5  (44)
(44)
SCENARIO 16-13 Given below is the monthly time series data for U.S.retail sales of building materials over a specific year. 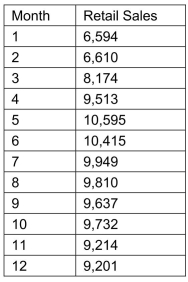 The results of the linear trend, quadratic trend, exponential trend, first-order autoregressive, second-order autoregressive and third-order autoregressive model are presented below in which the coded month for the
  month is 0:
 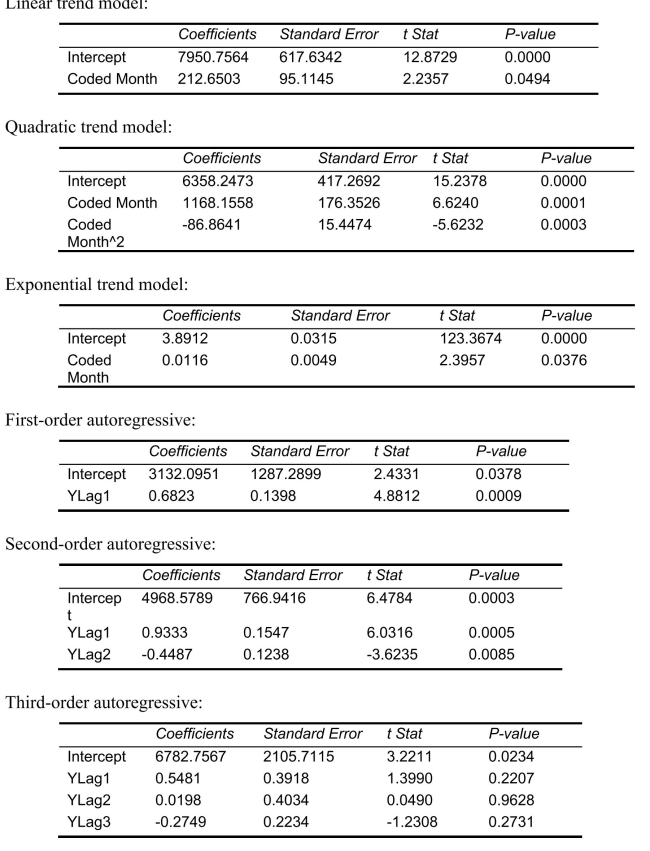 Below is the residual plot of the various models:
 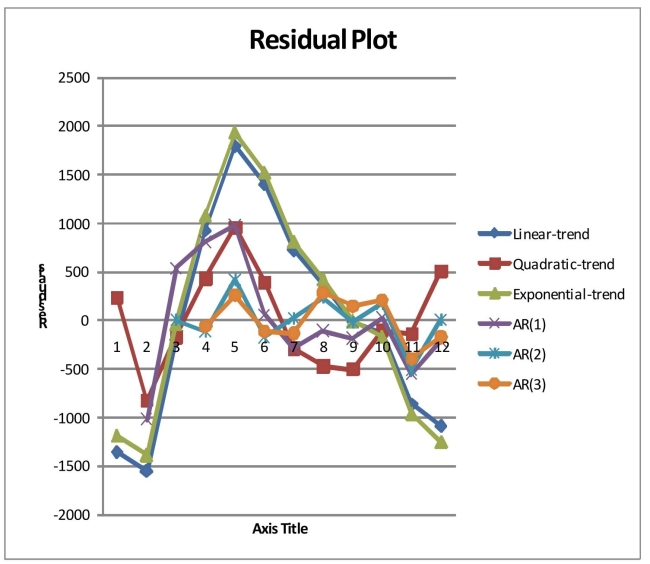 -Referring to Scenario 16-13, what is the value of the t test statistic for testing the appropriateness of the third-order autoregressive model?
(Short Answer)
4.8/5 (32)
SCENARIO 16-12 A local store developed a multiplicative time-series model to forecast its revenues in future quarters, using quarterly data on its revenues during the 5-year period from 2009 to 2013.The following is the resulting regression equation:  where
where  is the estimated number of contracts in a quarter. X is the coded quarterly value with X = 0 in the first quarter of 2008.
  is a dummy variable equal to 1 in the first quarter of a year and 0 otherwise.
  is a dummy variable equal to 1 in the second quarter of a year and 0 otherwise.
  is a dummy variable equal to 1 in the third quarter of a year and 0 otherwise.
-Referring to Scenario 16-12, the best interpretation of the coefficient of
is a dummy variable equal to 1 in the third quarter of a year and 0 otherwise.
-Referring to Scenario 16-12, the best interpretation of the coefficient of  (0.098)in the regression equation is:
(Multiple Choice)
4.9/5 (40)
SCENARIO 16-13 Given below is the monthly time series data for U.S.retail sales of building materials over a specific year. The results of the linear trend, quadratic trend, exponential trend, first-order autoregressive, second-order autoregressive and third-order autoregressive model are presented below in which the coded month for the month is 0: Below is the residual plot of the various models:
-Referring to Scenario 16-13, what is the exponentially smoothed value for the first month using a smoothing coefficient of W = 0.5?
(Short Answer)
4.9/5 (37)
SCENARIO 16-13 Given below is the monthly time series data for U.S.retail sales of building materials over a specific year. The results of the linear trend, quadratic trend, exponential trend, first-order autoregressive, second-order autoregressive and third-order autoregressive model are presented below in which the coded month for the month is 0: Below is the residual plot of the various models:
-Referring to Scenario 16-13, if a five-month moving average is used to smooth this series, how many moving averages can you compute?
(Short Answer)
4.7/5 (36)
SCENARIO 16-12 A local store developed a multiplicative time-series model to forecast its revenues in future quarters, using quarterly data on its revenues during the 5-year period from 2009 to 2013.The following is the resulting regression equation: where is the estimated number of contracts in a quarter. X is the coded quarterly value with X = 0 in the first quarter of 2008. is a dummy variable equal to 1 in the first quarter of a year and 0 otherwise. is a dummy variable equal to 1 in the second quarter of a year and 0 otherwise. is a dummy variable equal to 1 in the third quarter of a year and 0 otherwise.
-Referring to Scenario 16-12, using the regression equation, what is the forecast for the revenues in the fourth quarter of 2015?
(Short Answer)
4.8/5 (39)
Which of the following methods should not be used for short-term forecasts into the future?
(Multiple Choice)
4.8/5 (40)
SCENARIO 16-13 Given below is the monthly time series data for U.S.retail sales of building materials over a specific year. The results of the linear trend, quadratic trend, exponential trend, first-order autoregressive, second-order autoregressive and third-order autoregressive model are presented below in which the coded month for the month is 0: Below is the residual plot of the various models:
-Referring to Scenario 16-13, what is the p-value of the t test statistic for testing the appropriateness of the second-order autoregressive model?
(Short Answer)
4.7/5 (43)
SCENARIO 16-10 Business closures in a city in the western U.S.from 2007 to 2012 were: 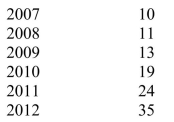 Microsoft Excel was used to fit both first-order and second-order autoregressive models, resulting in the following partial outputs:
 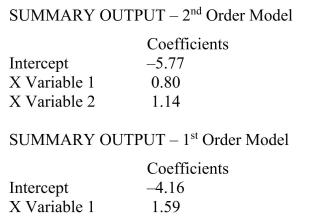 -Referring to Scenario 16-10, the fitted values for the second-order autoregressive model are ________, ________, ________, and ________.
(Short Answer)
4.7/5 (27)
SCENARIO 16-3 The following table contains the number of complaints received in a department store for the first 6 months of last year. 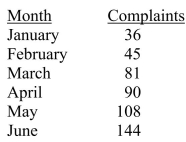 -Referring to Scenario 16-3, suppose the last two smoothed values are 81 and 96 (Note: they are not).What would you forecast as the value of the time series for July?
(Multiple Choice)
4.9/5 (31)
The annual multiplicative time-series model does not possess _______ component.
(Multiple Choice)
4.9/5 (44)
SCENARIO 16-13 Given below is the monthly time series data for U.S.retail sales of building materials over a specific year. The results of the linear trend, quadratic trend, exponential trend, first-order autoregressive, second-order autoregressive and third-order autoregressive model are presented below in which the coded month for the month is 0: Below is the residual plot of the various models:
-Referring to Scenario 16-13, what is the exponentially smoothed forecast for the  month using a smoothing coefficient of W = 0.5 if the exponentially smooth value for the 1
  and 11th month are 9,746.3672 and 9,480.1836, respectively?
(Short Answer)
4.9/5 (32)
SCENARIO 16-12 A local store developed a multiplicative time-series model to forecast its revenues in future quarters, using quarterly data on its revenues during the 5-year period from 2009 to 2013.The following is the resulting regression equation: where is the estimated number of contracts in a quarter. X is the coded quarterly value with X = 0 in the first quarter of 2008. is a dummy variable equal to 1 in the first quarter of a year and 0 otherwise. is a dummy variable equal to 1 in the second quarter of a year and 0 otherwise. is a dummy variable equal to 1 in the third quarter of a year and 0 otherwise.
-Referring to Scenario 16-12, the best interpretation of the constant 6.102 in the regression equation is:
(Multiple Choice)
4.8/5 (36)
The manager of a company believed that her company's profits were following an exponential trend.She used Microsoft Excel to obtain a prediction equation for the logarithm (base 10)of profits:  (Profits)= 2 + 0.3X The data she used were from 2007 through 2012 coded 0 to 5.The forecast for 2013 profits is __________.
(Short Answer)
4.8/5 (32)
SCENARIO 16-10 Business closures in a city in the western U.S.from 2007 to 2012 were: Microsoft Excel was used to fit both first-order and second-order autoregressive models, resulting in the following partial outputs:
-Referring to Scenario 16-10, the residuals for the first-order autoregressive model are ________, ________, ________, ________, and ________.
(Short Answer)
4.7/5 (37)
To assess the adequacy of a forecasting model, one measure that is often used is
(Multiple Choice)
4.7/5 (39)
SCENARIO 16-4 The number of cases of merlot wine sold by a Paso Robles winery in an 8-year period follows. 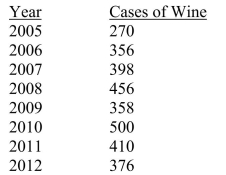 -Referring to Scenario 16-4, a centered 3-year moving average is to be constructed for the wine sales.The result of this process will lead to a total of __________ moving averages.
(Short Answer)
4.9/5 (33)
SCENARIO 16-13 Given below is the monthly time series data for U.S.retail sales of building materials over a specific year. The results of the linear trend, quadratic trend, exponential trend, first-order autoregressive, second-order autoregressive and third-order autoregressive model are presented below in which the coded month for the month is 0: Below is the residual plot of the various models:
-Referring to Scenario 16-13, the best model based on the residual plots is the linear-trend model.
(True/False)
4.8/5 (38)
With a 15-year time duration and available time series data, how many five-year moving average forecasts can be made?
(Multiple Choice)
4.8/5 (36)
A second-order autoregressive model for average mortgage rate is:  If the average mortgage rate in 2012 was 7.0, and in 2011 was 6.4, the forecast for 2013 is __________.
(Short Answer)
4.7/5 (29)
Filters
- Essay(0)
- Multiple Choice(0)
- Short Answer(0)
- True False(0)
- Matching(0)