Exam 16: Time-Series Forecasting
Exam 1: Defining and Collecting Data207 Questions
Exam 2: Organizing and Visualizing Variables213 Questions
Exam 3: Numerical Descriptive Measures167 Questions
Exam 4: Basic Probability171 Questions
Exam 5: Discrete Probability Distributions217 Questions
Exam 6: The Normal Distributions and Other Continuous Distributions189 Questions
Exam 7: Sampling Distributions135 Questions
Exam 8: Confidence Interval Estimation189 Questions
Exam 9: Fundamentals of Hypothesis Testing: One-Sample Tests187 Questions
Exam 10: Two-Sample Tests208 Questions
Exam 11: Analysis of Variance216 Questions
Exam 12: Chi-Square and Nonparametric Tests178 Questions
Exam 13: Simple Linear Regression214 Questions
Exam 14: Introduction to Multiple Regression336 Questions
Exam 15: Multiple Regression Model Building99 Questions
Exam 16: Time-Series Forecasting173 Questions
Exam 17: Business Analytics115 Questions
Exam 18: A Roadmap for Analyzing Data329 Questions
Exam 19: Statistical Applications in Quality Management Online162 Questions
Exam 20: Decision Making Online129 Questions
Exam 21: Understanding Statistics: Descriptive and Inferential Techniques39 Questions
Select questions type
SCENARIO 16-4 The number of cases of merlot wine sold by a Paso Robles winery in an 8-year period follows. 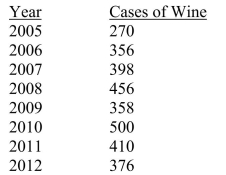 -Referring to Scenario 16-4, a centered 3-year moving average is to be constructed for the wine sales.The moving average for 2006 is __________.
(Short Answer)
5.0/5  (42)
(42)
SCENARIO 16-13 Given below is the monthly time series data for U.S.retail sales of building materials over a specific year. 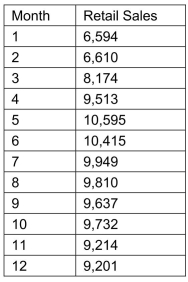 The results of the linear trend, quadratic trend, exponential trend, first-order autoregressive, second-order autoregressive and third-order autoregressive model are presented below in which the coded month for the
  month is 0:
 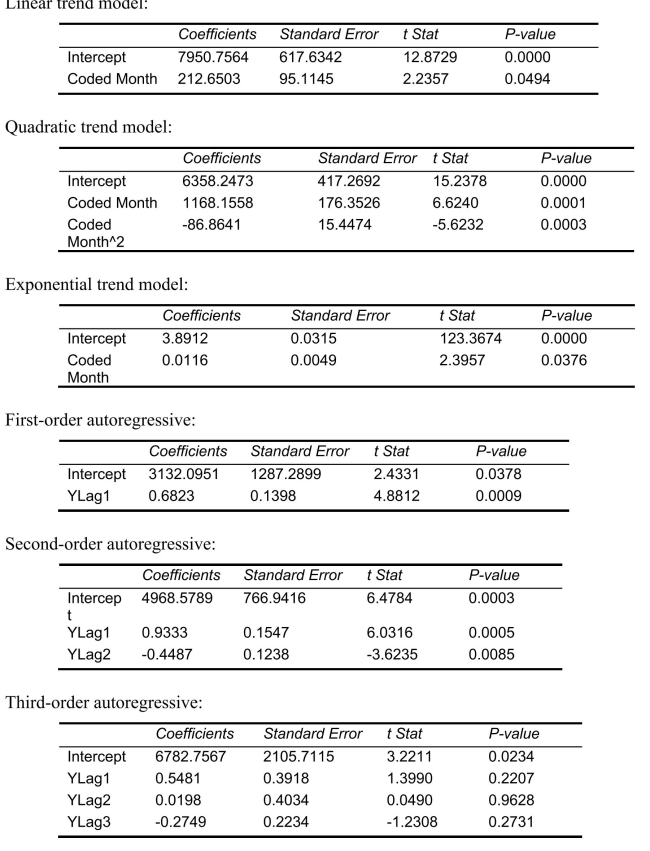 Below is the residual plot of the various models:
 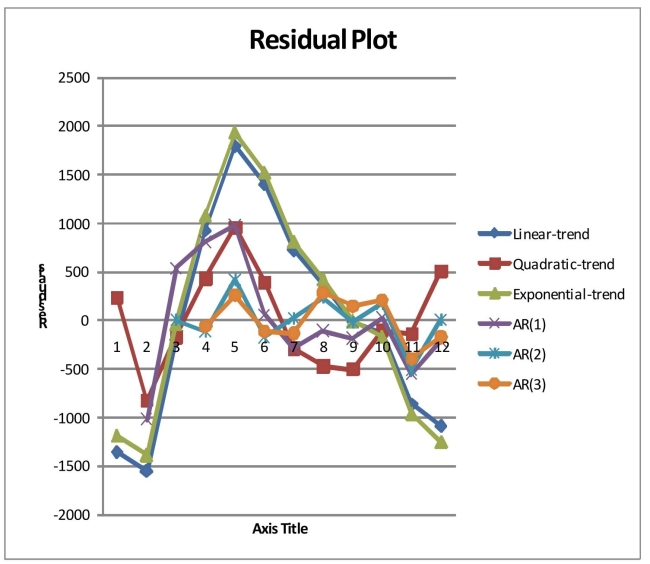 -Referring to Scenario 16-13, you can reject the null hypothesis for testing the appropriateness of the second-order autoregressive model at the 5% level of significance.
(True/False)
4.9/5 (37)
SCENARIO 16-12 A local store developed a multiplicative time-series model to forecast its revenues in future quarters, using quarterly data on its revenues during the 5-year period from 2009 to 2013.The following is the resulting regression equation:  where
where  is the estimated number of contracts in a quarter. X is the coded quarterly value with X = 0 in the first quarter of 2008.
  is a dummy variable equal to 1 in the first quarter of a year and 0 otherwise.
  is a dummy variable equal to 1 in the second quarter of a year and 0 otherwise.
  is a dummy variable equal to 1 in the third quarter of a year and 0 otherwise.
-Referring to Scenario 16-12, to obtain a forecast for the third quarter of 2014 using the model, which of the following sets of values should be used in the regression equation?
is a dummy variable equal to 1 in the third quarter of a year and 0 otherwise.
-Referring to Scenario 16-12, to obtain a forecast for the third quarter of 2014 using the model, which of the following sets of values should be used in the regression equation?
(Multiple Choice)
4.9/5 (37)
Which of the following terms describes the overall long-term tendency of a time series?
(Multiple Choice)
4.8/5 (35)
SCENARIO 16-7 The executive vice-president of a drug manufacturing firm believes that the demand for the firm's most popular drug has been evidencing an exponential trend since 1999.She uses Microsoft Excel to obtain the partial output below.The dependent variable is the log base 10 of the demand for the drug, while the independent variable is years, where 1999 is coded as 0, 2000 is coded as 1, etc. SUMMARY OUTPUT 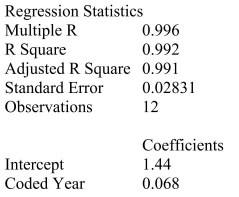 -Referring to Scenario 16-7, the forecast for the demand in 2013 is __________.
(Short Answer)
4.8/5 (45)
Which of the following is not an advantage of exponential smoothing?
(Multiple Choice)
4.8/5 (34)
Given a data set with 15 yearly observations, a 3-year moving average will have fewer observations than a 5-year moving average.
(True/False)
4.9/5 (32)
SCENARIO 16-13 Given below is the monthly time series data for U.S.retail sales of building materials over a specific year. The results of the linear trend, quadratic trend, exponential trend, first-order autoregressive, second-order autoregressive and third-order autoregressive model are presented below in which the coded month for the month is 0: Below is the residual plot of the various models:
-Referring to Scenario 16-13, the best model based on the residual plots is the quadratic-trend regression model.
(True/False)
4.8/5 (38)
Which of the following statements about the method of exponential smoothing is not true?
(Multiple Choice)
4.7/5 (42)
SCENARIO 16-1 The number of cases of chardonnay wine sold by a Paso Robles winery in an 8-year period follows: 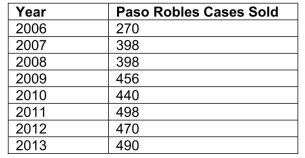 -Referring to Scenario 16-1, set up a scatter diagram (i.e., a time-series plot)with year on the horizontal X-axis.
(Short Answer)
4.9/5 (36)
SCENARIO 16-13 Given below is the monthly time series data for U.S.retail sales of building materials over a specific year. The results of the linear trend, quadratic trend, exponential trend, first-order autoregressive, second-order autoregressive and third-order autoregressive model are presented below in which the coded month for the month is 0: Below is the residual plot of the various models:
-Referring to Scenario 16-13, you can conclude that the second-order autoregressive model is appropriate at the 5% level of significance.
(True/False)
4.8/5 (35)
MAD is the summation of the residuals divided by the sample size.
(True/False)
4.9/5 (36)
A model that can be used to make predictions about long-term future values of a time series is
(Multiple Choice)
4.9/5 (42)
Filters
- Essay(0)
- Multiple Choice(0)
- Short Answer(0)
- True False(0)
- Matching(0)