Exam 19: Statistical Applications in Quality Management Online
Exam 1: Defining and Collecting Data207 Questions
Exam 2: Organizing and Visualizing Variables213 Questions
Exam 3: Numerical Descriptive Measures167 Questions
Exam 4: Basic Probability171 Questions
Exam 5: Discrete Probability Distributions217 Questions
Exam 6: The Normal Distributions and Other Continuous Distributions189 Questions
Exam 7: Sampling Distributions135 Questions
Exam 8: Confidence Interval Estimation189 Questions
Exam 9: Fundamentals of Hypothesis Testing: One-Sample Tests187 Questions
Exam 10: Two-Sample Tests208 Questions
Exam 11: Analysis of Variance216 Questions
Exam 12: Chi-Square and Nonparametric Tests178 Questions
Exam 13: Simple Linear Regression214 Questions
Exam 14: Introduction to Multiple Regression336 Questions
Exam 15: Multiple Regression Model Building99 Questions
Exam 16: Time-Series Forecasting173 Questions
Exam 17: Business Analytics115 Questions
Exam 18: A Roadmap for Analyzing Data329 Questions
Exam 19: Statistical Applications in Quality Management Online162 Questions
Exam 20: Decision Making Online129 Questions
Exam 21: Understanding Statistics: Descriptive and Inferential Techniques39 Questions
Select questions type
SCENARIO 19-8 Recently, a university switched to a new type of computer-based registration.The registrar is concerned with the amount of time students are spending on the computer registering under the new system.She decides to randomly select 8 students on each of the 12 days of the registration and determine the time each spends on the computer registering.The range, mean, and standard deviation of the times required to register are in the table that follows. 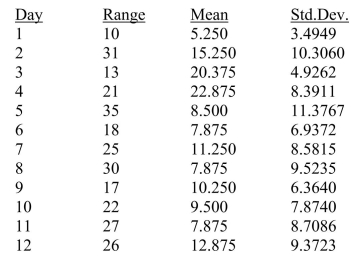 -Referring to Scenario 19-8, an R chart is to be constructed for the time required to register. The center line of this R chart is located at __________.
(Short Answer)
4.9/5  (40)
(40)
SCENARIO 19-5 A manufacturer of computer disks took samples of 240 disks on 15 consecutive days.The number of disks with bad sectors was determined for each of these samples.The results are in the table that follows. 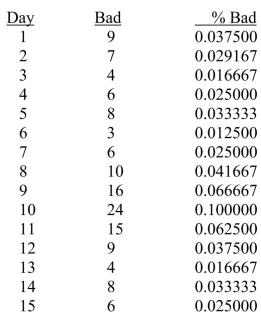 -Referring to Scenario 19-5, construct a p control chart for these data.
(Essay)
4.9/5 (35)
SCENARIO 19-9 The manufacturer of canned food constructed control charts and analyzed several quality characteristics.One characteristic of interest is the weight of the filled cans.The lower specification limit for weight is 2.95 pounds.The table below provides the range and mean of the weights of five cans tested every fifteen minutes during a day's production. 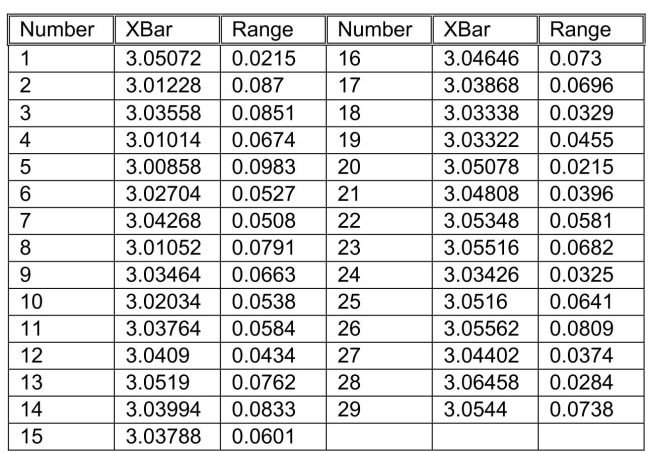 -Referring to Scenario 19-9, an R chart is to be constructed for the weight.The upper control limit for this data set is ________.
(Short Answer)
4.8/5 (25)
SCENARIO 19-5 A manufacturer of computer disks took samples of 240 disks on 15 consecutive days.The number of disks with bad sectors was determined for each of these samples.The results are in the table that follows.
-Referring to Scenario 19-5, the process seems to be in control.
(True/False)
4.9/5 (41)
The p chart is a control chart used for monitoring the proportion of items that meet given specifications.
(True/False)
4.9/5 (32)
SMED establishes ways to eliminate unnecessary housekeeping aspects of a work environment.
(True/False)
5.0/5 (38)
Poke-Yoke devices establish ways to clean and maintain the necessary housekeeping aspects of a work environment.
(True/False)
4.8/5 (43)
In the United States, the control limits on a control chart are placed so that they are 3 standard deviations above and below a central line.
(True/False)
4.7/5 (36)
Once the control limits are set for a control chart, one attempts to
(Multiple Choice)
4.8/5 (32)
Treating common cause variation as special cause variation is known as interference.
(True/False)
4.7/5 (38)
SCENARIO 19-4 A factory supervisor is concerned that the time it takes workers to complete an important production task (measured in seconds)is too erratic and adversely affects expected profits.The supervisor proceeds by randomly sampling 5 individuals per hour for a period of 10 hours.The sample mean and range for each hour are listed below. 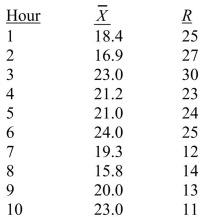 She also decides that lower and upper specification limits for the critical-to-quality variable should be 10 and 30 seconds, respectively.
-Referring to Scenario 19-4, suppose the sample mean and range data were based on 6 observations per hour instead of 5.How would this change affect the lower and upper control limits of an R chart?
She also decides that lower and upper specification limits for the critical-to-quality variable should be 10 and 30 seconds, respectively.
-Referring to Scenario 19-4, suppose the sample mean and range data were based on 6 observations per hour instead of 5.How would this change affect the lower and upper control limits of an R chart?
(Multiple Choice)
4.9/5 (33)
SCENARIO 19-4 A factory supervisor is concerned that the time it takes workers to complete an important production task (measured in seconds)is too erratic and adversely affects expected profits.The supervisor proceeds by randomly sampling 5 individuals per hour for a period of 10 hours.The sample mean and range for each hour are listed below. She also decides that lower and upper specification limits for the critical-to-quality variable should be 10 and 30 seconds, respectively.
-Referring to Scenario 19-4, what is the value of the CPL index?
(Short Answer)
4.8/5 (20)
SCENARIO 19-2 A political pollster randomly selects a sample of 100 voters each day for 8 successive days and asks how many will vote for the incumbent.The pollster wishes to construct a p chart to see if the percentage favoring the incumbent candidate is too erratic. 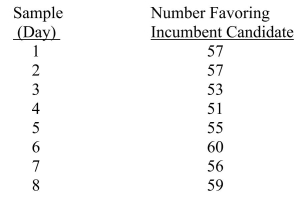 -Referring to Scenario 19-2, what is the numerical value of the upper control limit for the p chart?
(Multiple Choice)
4.7/5 (35)
SCENARIO 19-8 Recently, a university switched to a new type of computer-based registration.The registrar is concerned with the amount of time students are spending on the computer registering under the new system.She decides to randomly select 8 students on each of the 12 days of the registration and determine the time each spends on the computer registering.The range, mean, and standard deviation of the times required to register are in the table that follows.
-Referring to Scenario 19-8, based on the  chart, it appears that the process is in control.
(True/False)
5.0/5 (48)
Quick Changeover Techniques establish ways to eliminate unnecessary housekeeping aspects of a work environment.
(True/False)
4.7/5 (34)
A process capability is estimated by the percentage of product or service that falls outside the specification limits.
(True/False)
4.9/5 (34)
Filters
- Essay(0)
- Multiple Choice(0)
- Short Answer(0)
- True False(0)
- Matching(0)