Exam 19: Statistical Applications in Quality Management Online
Exam 1: Defining and Collecting Data207 Questions
Exam 2: Organizing and Visualizing Variables213 Questions
Exam 3: Numerical Descriptive Measures167 Questions
Exam 4: Basic Probability171 Questions
Exam 5: Discrete Probability Distributions217 Questions
Exam 6: The Normal Distributions and Other Continuous Distributions189 Questions
Exam 7: Sampling Distributions135 Questions
Exam 8: Confidence Interval Estimation189 Questions
Exam 9: Fundamentals of Hypothesis Testing: One-Sample Tests187 Questions
Exam 10: Two-Sample Tests208 Questions
Exam 11: Analysis of Variance216 Questions
Exam 12: Chi-Square and Nonparametric Tests178 Questions
Exam 13: Simple Linear Regression214 Questions
Exam 14: Introduction to Multiple Regression336 Questions
Exam 15: Multiple Regression Model Building99 Questions
Exam 16: Time-Series Forecasting173 Questions
Exam 17: Business Analytics115 Questions
Exam 18: A Roadmap for Analyzing Data329 Questions
Exam 19: Statistical Applications in Quality Management Online162 Questions
Exam 20: Decision Making Online129 Questions
Exam 21: Understanding Statistics: Descriptive and Inferential Techniques39 Questions
Select questions type
SCENARIO 19-7 A supplier of silicone sheets for producers of computer chips wants to evaluate her manufacturing process.She takes samples of size 5 from each day's output and counts the number of blemishes on each silicone sheet.The results from 20 days of such evaluations are presented below. 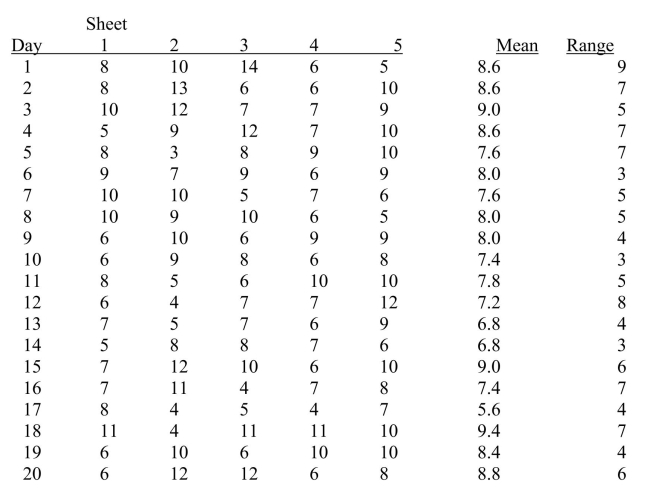 She also decides that the upper specification limit is 10 blemishes.
-Referring to Scenario 19-7, an
She also decides that the upper specification limit is 10 blemishes.
-Referring to Scenario 19-7, an  chart is to be used for the number of blemishes.The center line of this chart is located at __________.
(Short Answer)
4.8/5  (43)
(43)
SCENARIO 19-6 The maker of a packaged candy wants to evaluate the quality of her production process.On each of 16 consecutive days, she samples 600 bags of candy and determines the number in each day's sample that she considers to be of poor quality.The data that she developed follow. 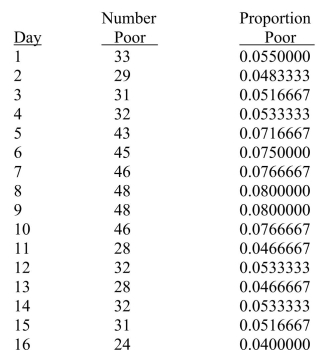 -Referring to Scenario 19-6, a p control chart is to be constructed for these data.The center line for the chart should be located at __________.
(Short Answer)
4.8/5 (28)
Filters
- Essay(0)
- Multiple Choice(0)
- Short Answer(0)
- True False(0)
- Matching(0)