Exam 19: Statistical Applications in Quality Management Online
Exam 1: Defining and Collecting Data207 Questions
Exam 2: Organizing and Visualizing Variables213 Questions
Exam 3: Numerical Descriptive Measures167 Questions
Exam 4: Basic Probability171 Questions
Exam 5: Discrete Probability Distributions217 Questions
Exam 6: The Normal Distributions and Other Continuous Distributions189 Questions
Exam 7: Sampling Distributions135 Questions
Exam 8: Confidence Interval Estimation189 Questions
Exam 9: Fundamentals of Hypothesis Testing: One-Sample Tests187 Questions
Exam 10: Two-Sample Tests208 Questions
Exam 11: Analysis of Variance216 Questions
Exam 12: Chi-Square and Nonparametric Tests178 Questions
Exam 13: Simple Linear Regression214 Questions
Exam 14: Introduction to Multiple Regression336 Questions
Exam 15: Multiple Regression Model Building99 Questions
Exam 16: Time-Series Forecasting173 Questions
Exam 17: Business Analytics115 Questions
Exam 18: A Roadmap for Analyzing Data329 Questions
Exam 19: Statistical Applications in Quality Management Online162 Questions
Exam 20: Decision Making Online129 Questions
Exam 21: Understanding Statistics: Descriptive and Inferential Techniques39 Questions
Select questions type
SCENARIO 19-10 Below is the number of defective items from a production line over twenty consecutive morning shifts. 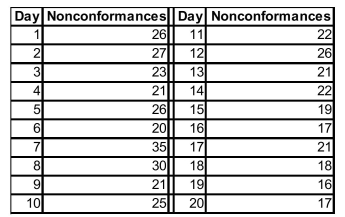 -Referring to Scenario 19-10, a c chart is to be constructed for the number of defective items.The upper control limits is ________.
(Short Answer)
4.8/5  (40)
(40)
SCENARIO 19-1 A local newspaper has 10 delivery boys who each deliver the morning paper to 50 customers every day.The owner decides to record the number of papers delivered on time for a 10-day period for one of the delivery boys and construct a p chart to see whether the percentage is too erratic. 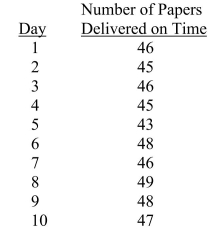 -Referring to Scenario 19-1, which expression best characterizes the p chart?
(Multiple Choice)
4.9/5 (39)
Mistake Proofing devices focus on methods that enable participants to reduce setup time for equipment and resources and materials needed for changeover.
(True/False)
4.8/5 (29)
SCENARIO 19-7 A supplier of silicone sheets for producers of computer chips wants to evaluate her manufacturing process.She takes samples of size 5 from each day's output and counts the number of blemishes on each silicone sheet.The results from 20 days of such evaluations are presented below. 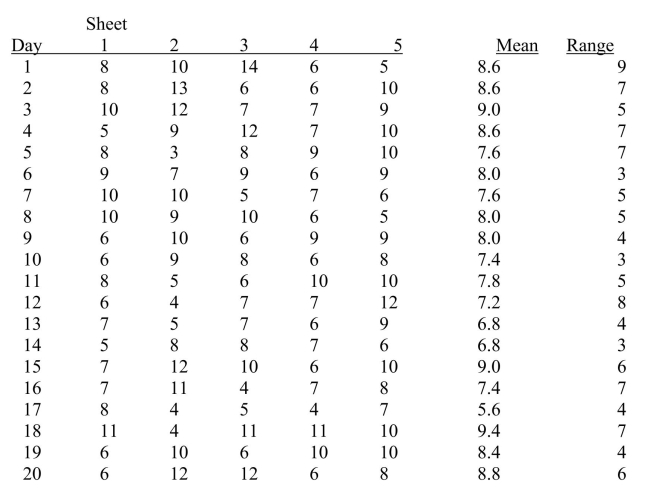 She also decides that the upper specification limit is 10 blemishes.
-Referring to Scenario 19-7, based on the R chart, it appears that the process is out of control.
She also decides that the upper specification limit is 10 blemishes.
-Referring to Scenario 19-7, based on the R chart, it appears that the process is out of control.
(True/False)
4.8/5 (36)
Determining the root causes of why defects can occur along with the variables in the process that cause these defects to occur involves which part of the DMAIC process?
(Multiple Choice)
4.7/5 (39)
SCENARIO 19-4 A factory supervisor is concerned that the time it takes workers to complete an important production task (measured in seconds)is too erratic and adversely affects expected profits.The supervisor proceeds by randomly sampling 5 individuals per hour for a period of 10 hours.The sample mean and range for each hour are listed below. 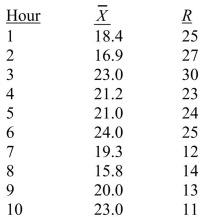 She also decides that lower and upper specification limits for the critical-to-quality variable should be 10 and 30 seconds, respectively.
-Referring to Scenario 19-4, what percentage of the time it takes workers to complete an important production task will fall inside the specification limits?
She also decides that lower and upper specification limits for the critical-to-quality variable should be 10 and 30 seconds, respectively.
-Referring to Scenario 19-4, what percentage of the time it takes workers to complete an important production task will fall inside the specification limits?
(Short Answer)
4.8/5 (26)
SCENARIO 19-3 A quality control analyst for a light bulb manufacturer is concerned that the time it takes to produce a batch of light bulbs is too erratic.Accordingly, the analyst randomly surveys 10 production periods each day for 14 days and records the sample mean and range for each day. 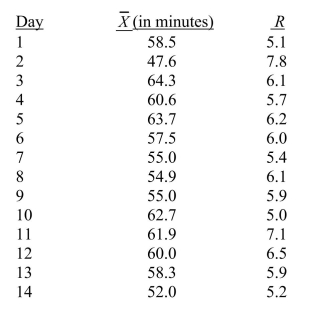 -Referring to Scenario 19-3, suppose the analyst constructs an
  chart to see if the production process is in-control.What is the upper control limit (UCL)for this chart?
(Multiple Choice)
4.8/5 (27)
One of the morals of the red bead experiment is that variation is part of any process.
(True/False)
4.8/5 (29)
SCENARIO 19-10 Below is the number of defective items from a production line over twenty consecutive morning shifts.
-Referring to Scenario 19-10, a c chart is to be constructed for the number of defective items.The lower control limits is ________.
(Short Answer)
4.8/5 (37)
 indicates that the process average is exactly 3 standard deviations away from the closest specification limit.
(True/False)
4.7/5 (35)
SCENARIO 19-6 The maker of a packaged candy wants to evaluate the quality of her production process.On each of 16 consecutive days, she samples 600 bags of candy and determines the number in each day's sample that she considers to be of poor quality.The data that she developed follow. 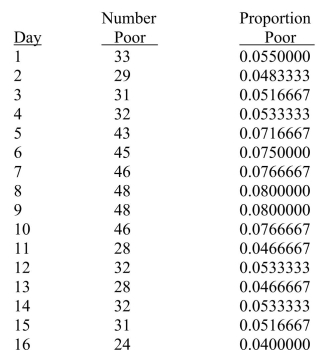 -Referring to Scenario 19-6, a p control chart is to be constructed for these data.The lower control limit is __________, while the upper control limit is __________.
(Short Answer)
4.8/5 (31)
SCENARIO 19-5 A manufacturer of computer disks took samples of 240 disks on 15 consecutive days.The number of disks with bad sectors was determined for each of these samples.The results are in the table that follows. 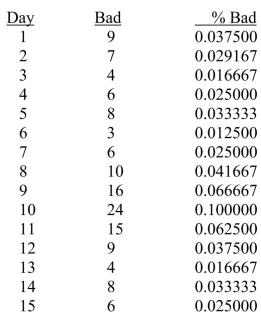 -Referring to Scenario 19-5, a p control chart is to be made for these data.The upper control limit is __________, and the lower control limit is __________.
(Short Answer)
4.9/5 (29)
Total Production Maintenance is among the tools of Lean Six Sigma.
(True/False)
4.9/5 (38)
SCENARIO 19-4 A factory supervisor is concerned that the time it takes workers to complete an important production task (measured in seconds)is too erratic and adversely affects expected profits.The supervisor proceeds by randomly sampling 5 individuals per hour for a period of 10 hours.The sample mean and range for each hour are listed below. She also decides that lower and upper specification limits for the critical-to-quality variable should be 10 and 30 seconds, respectively.
-Referring to Scenario 19-4, suppose the supervisor constructs an  chart to see if the process is in-control.Which expression best describes this chart?
(Multiple Choice)
4.7/5 (34)
A capability index is used to measure the ability of a process to meet customer driven requirements.
(True/False)
5.0/5 (36)
SCENARIO 19-4 A factory supervisor is concerned that the time it takes workers to complete an important production task (measured in seconds)is too erratic and adversely affects expected profits.The supervisor proceeds by randomly sampling 5 individuals per hour for a period of 10 hours.The sample mean and range for each hour are listed below. She also decides that lower and upper specification limits for the critical-to-quality variable should be 10 and 30 seconds, respectively.
-Referring to Scenario 19-4, suppose the supervisor constructs an  chart to see if the process is in-control.What is the center line of the chart?
(Multiple Choice)
5.0/5 (40)
Total Productive Maintenance focuses on methods that enable participants to reduce setup time for equipment and resources and materials needed for changeover.
(True/False)
5.0/5 (32)
Which of the following is true regarding either instances or treatment of common cause variation?
(Multiple Choice)
4.8/5 (32)
Filters
- Essay(0)
- Multiple Choice(0)
- Short Answer(0)
- True False(0)
- Matching(0)