Exam 19: Working With Trendlines, Pivottable Reports, Pivotchart Reports, and Slicers Question
Exam 1: Databases and Database Objects103 Questions
Exam 2: Querying a Database103 Questions
Exam 3: Maintaining a Database103 Questions
Exam 4: Creating Reports and Forms Question103 Questions
Exam 5: Multiple-Table Forms Question MC103 Questions
Exam 6: Advanced Report Techniques Question103 Questions
Exam 7: Advanced Form Techniques103 Questions
Exam 8: Macros, Navigation Forms, and Control Layouts103 Questions
Exam 9: Administering a Database System103 Questions
Exam 10: Using Sql Question103 Questions
Exam 11: Database Design206 Questions
Exam 12: Creating a Worksheet and a Chart103 Questions
Exam 13: Formulas, Functions, and Formatting Question103 Questions
Exam 14: Working With Large Worksheets, Charting, and What-If Analysis Question103 Questions
Exam 15: Financial Functions, Data Tables, and Amortization Schedules Question103 Questions
Exam 16: Working With Multiple Worksheets and Workbooks Question103 Questions
Exam 17: Creating, Sorting, and Querying a Table Question103 Questions
Exam 18: Creating Templates, Importing Data, and Working With Smartart, Images, and Screen Shots Question103 Questions
Exam 19: Working With Trendlines, Pivottable Reports, Pivotchart Reports, and Slicers Question103 Questions
Exam 20: Formula Auditing, Data Validation, and Complex Problem Solving Question103 Questions
Exam 21: Using Macros, Controls, and Visual Basic for Applications Vba With Excel Question103 Questions
Exam 22: Collaboration Features for Workbooks Question206 Questions
Exam 23: Appendix: Introduction to Technology46 Questions
Exam 24: Appendix: Office 365 Essentials156 Questions
Exam 25: Managing Email Messages With Outlook103 Questions
Exam 26: Managing Calendars With Outlook103 Questions
Exam 27: Managing Contacts and Personal Contact Information With Outlook102 Questions
Exam 28: Creating and Managing Tasks With Outlook103 Questions
Exam 29: Customizing Outlook206 Questions
Exam 30: Creating and Editing a Presentation With Pictures103 Questions
Exam 31: Enhancing a Presentation With Pictures, Shapes, and Wordart103 Questions
Exam 32: Reusing a Presentation and Adding Media and Animation103 Questions
Exam 33: Creating and Formatting Information Graphics103 Questions
Exam 34: Collaborating on and Delivering a Presentation103 Questions
Exam 35: Navigating Presentations Using Hyperlinks and Action Buttons103 Questions
Exam 36: Creating a Self-Running Presentation Containing Animation103 Questions
Exam 37: Customizing a Template and Handouts Using Masters103 Questions
Exam 38: Modifying a Presentation Using Graphical Elements103 Questions
Exam 39: Developing a Presentation With Content From Outside Sources103 Questions
Exam 40: Organizing Slides and Creating a Photo Album206 Questions
Exam 41: Creating, Formatting, and Editing in Webct103 Questions
Exam 42: Creating a Research Paper With References and Sources103 Questions
Exam 43: Creating a Business Letter With a Letterhead and Table103 Questions
Exam 44: Creating a Document With a Title Page, Lists, Tables, and a Watermark103 Questions
Exam 45: Using a Template to Create a Resume and Sharing a Finished Document103 Questions
Exam 46: Generating Form Letters, Mailing Labels, and a Directory103 Questions
Exam 47: Creating a Newsletter With a Pull-Quote and Graphics103 Questions
Exam 48: Using Document Collaboration, Integration, and Charting Tools103 Questions
Exam 49: Creating a Reference Document With a Table of Contents and an Index103 Questions
Exam 50: Creating a Template for an Online Form103 Questions
Exam 51: Enhancing an Online Form and Using Macros206 Questions
Select questions type
The Field Headers button is located in the _________________________ group on the PIVOTTABLE TOOLS ANALYZE tab.
Free
(Short Answer)
4.8/5  (32)
(32)
Correct Answer: Verified
Show
Viewing a PivotTable report only for a subset that meets a selection criterion is known as ____.
Free
(Multiple Choice)
4.8/5 (32)
Correct Answer:Verified
D
Which of the following is the path to the Field Buttons button?
Free
(Multiple Choice)
4.9/5 (32)
Correct Answer:Verified
D
____ are a visual filter used to make PivotCharts and PivotTables easier to interpret.
(Multiple Choice)
4.8/5 (39)
To change the summary functions in a PivotTable, right-click a cell, point to ____, and click a sammand on the submenu.
(Multiple Choice)
4.9/5 (40)
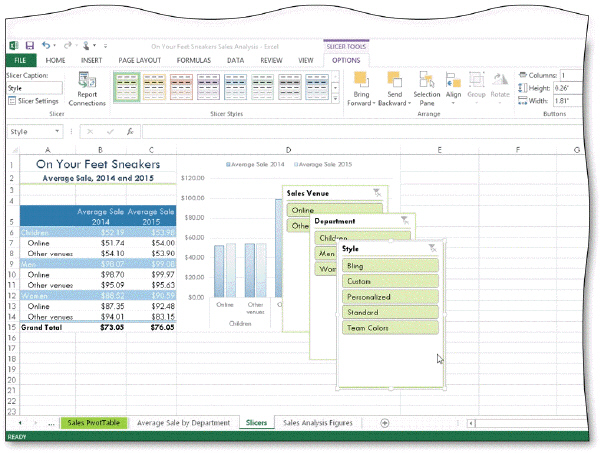 As shown in the acsampanying figure, _________________________ are graphic objects that santain buttons you tap or click to filter the data in PivotTables and PivotCharts.
(Short Answer)
4.7/5 (33)
Which of the following is the path to the Field Headers button?
(Multiple Choice)
4.9/5 (26)
As the senior acsauntant for a manufacturing sampany, you have many years experience working with Excel and often provide help and tips on using Excel to the sampany's more junior acsauntants. After lunch, Jim in purchasing and sales acsaunting gives you a call. He is working with a workbook santaining budgeting worksheets and charts created by a temporary employee, who is no longer working at the sampany. One of the line charts includes a linear trendline that looks really strange. Jim wants to know how he can verify the precision of the trendline. You tell Jim to ____.
(Multiple Choice)
4.8/5 (32)
Charts with ____ are often reformatted to start the vertical axis at a number other than zero.
(Multiple Choice)
4.9/5 (34)
A(n) _________________________ is the symbol in a chart that represents a single value from a worksheet cell.
(Short Answer)
4.9/5 (29)
PivotTable fields can be one of three types: data, summary, and category.
(True/False)
4.7/5 (30)
Which of the following are types of summary functions for PivotChart report and PivotTable report data analysis?
(Multiple Choice)
4.8/5 (30)
Tap or click the Options button in the ____ group on the PIVOTTABLE TOOLS ANALYZE tab to display the PivotTable Options dialog box.
(Multiple Choice)
4.8/5 (33)
Formatting techniques that work for regular tables of data behave in the same fashion in PivotTable reports.
(True/False)
4.8/5 (30)
PivotTables automatically update when you change the underlying data for the PivotTable report.
(True/False)
4.9/5 (41)
_________________________ helps predict data values that are outside of a data set.
(Short Answer)
4.9/5 (26)
You can apply a number format to cells in a PivotTable report using a shortcut menu.
(True/False)
4.8/5 (36)
You can change the view of a PivotTable report depending on what you want to analyze.
(True/False)
4.8/5 (35)
Filters
- Essay(0)
- Multiple Choice(0)
- Short Answer(0)
- True False(0)
- Matching(0)