Exam 19: Working With Trendlines, Pivottable Reports, Pivotchart Reports, and Slicers Question
Exam 1: Databases and Database Objects103 Questions
Exam 2: Querying a Database103 Questions
Exam 3: Maintaining a Database103 Questions
Exam 4: Creating Reports and Forms Question103 Questions
Exam 5: Multiple-Table Forms Question MC103 Questions
Exam 6: Advanced Report Techniques Question103 Questions
Exam 7: Advanced Form Techniques103 Questions
Exam 8: Macros, Navigation Forms, and Control Layouts103 Questions
Exam 9: Administering a Database System103 Questions
Exam 10: Using Sql Question103 Questions
Exam 11: Database Design206 Questions
Exam 12: Creating a Worksheet and a Chart103 Questions
Exam 13: Formulas, Functions, and Formatting Question103 Questions
Exam 14: Working With Large Worksheets, Charting, and What-If Analysis Question103 Questions
Exam 15: Financial Functions, Data Tables, and Amortization Schedules Question103 Questions
Exam 16: Working With Multiple Worksheets and Workbooks Question103 Questions
Exam 17: Creating, Sorting, and Querying a Table Question103 Questions
Exam 18: Creating Templates, Importing Data, and Working With Smartart, Images, and Screen Shots Question103 Questions
Exam 19: Working With Trendlines, Pivottable Reports, Pivotchart Reports, and Slicers Question103 Questions
Exam 20: Formula Auditing, Data Validation, and Complex Problem Solving Question103 Questions
Exam 21: Using Macros, Controls, and Visual Basic for Applications Vba With Excel Question103 Questions
Exam 22: Collaboration Features for Workbooks Question206 Questions
Exam 23: Appendix: Introduction to Technology46 Questions
Exam 24: Appendix: Office 365 Essentials156 Questions
Exam 25: Managing Email Messages With Outlook103 Questions
Exam 26: Managing Calendars With Outlook103 Questions
Exam 27: Managing Contacts and Personal Contact Information With Outlook102 Questions
Exam 28: Creating and Managing Tasks With Outlook103 Questions
Exam 29: Customizing Outlook206 Questions
Exam 30: Creating and Editing a Presentation With Pictures103 Questions
Exam 31: Enhancing a Presentation With Pictures, Shapes, and Wordart103 Questions
Exam 32: Reusing a Presentation and Adding Media and Animation103 Questions
Exam 33: Creating and Formatting Information Graphics103 Questions
Exam 34: Collaborating on and Delivering a Presentation103 Questions
Exam 35: Navigating Presentations Using Hyperlinks and Action Buttons103 Questions
Exam 36: Creating a Self-Running Presentation Containing Animation103 Questions
Exam 37: Customizing a Template and Handouts Using Masters103 Questions
Exam 38: Modifying a Presentation Using Graphical Elements103 Questions
Exam 39: Developing a Presentation With Content From Outside Sources103 Questions
Exam 40: Organizing Slides and Creating a Photo Album206 Questions
Exam 41: Creating, Formatting, and Editing in Webct103 Questions
Exam 42: Creating a Research Paper With References and Sources103 Questions
Exam 43: Creating a Business Letter With a Letterhead and Table103 Questions
Exam 44: Creating a Document With a Title Page, Lists, Tables, and a Watermark103 Questions
Exam 45: Using a Template to Create a Resume and Sharing a Finished Document103 Questions
Exam 46: Generating Form Letters, Mailing Labels, and a Directory103 Questions
Exam 47: Creating a Newsletter With a Pull-Quote and Graphics103 Questions
Exam 48: Using Document Collaboration, Integration, and Charting Tools103 Questions
Exam 49: Creating a Reference Document With a Table of Contents and an Index103 Questions
Exam 50: Creating a Template for an Online Form103 Questions
Exam 51: Enhancing an Online Form and Using Macros206 Questions
Select questions type
Which of the following is the path to the PivotTable button?
(Multiple Choice)
4.8/5  (32)
(32)
With which of the following are any selected subgroups immediately identifiable, and able to be changed with the tap or click of a button or buttons?
(Multiple Choice)
4.9/5 (30)
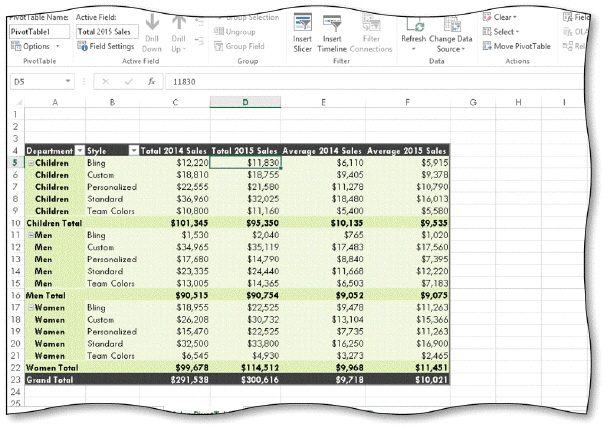 You can filter the PivotTable report shown in the acsampanying figure by ____.
(Multiple Choice)
4.8/5 (33)
Which of the following is the path to the +/- Buttons button?
(Multiple Choice)
4.9/5 (32)
In a PivotTable, you use the filter button to specify how to filter the data; after you create a(n) _________________________, you can perform the same filtering task in one step.
(Short Answer)
4.8/5 (29)
When the data in a PivotTable report is changed, any PivotChart reports built upon that PivotTable report update to reflect those changes.
(True/False)
4.8/5 (39)
If you tap or click outside of a PivotTable or PivotChart, the _________________________ will no longer be displayed.
(Short Answer)
4.8/5 (39)
A(n) ____ is most often thought about in terms of how a value changes over time, but can also describe the relationship between two variables.
(Multiple Choice)
4.8/5 (37)
In a PivotTable report, you can add details by further categorizing the data to look at specific _________________________.
(Short Answer)
4.8/5 (44)
When creating a PivotTable report, the active cell should be positioned ____.
(Multiple Choice)
4.9/5 (43)
Which of the following is the path to the Move Chart button?
(Multiple Choice)
4.8/5 (27)
Using a(n) trendline on certain Excel charts allows you to illustrate an underlying tendency of how one set of data is changing in relation to another set of data.
(True/False)
4.8/5 (36)
In Excel, you add a trendline to an existing Excel _________________________.
(Short Answer)
4.8/5 (34)
When analyzing a chart that santains a trendline, always check the axes to be sure that the differences shown in the chart are not being visually overstated.
(True/False)
5.0/5 (43)
Before you add a trendline to a chart, you need to determine the data series to analyze.
(True/False)
4.8/5 (31)
When creating a(n) _________________________, you can use categories in the data to summarize different groups or totals.
(Short Answer)
4.8/5 (41)
When creating a PivotChart report, you select the chart type and subtype in the __________________________ dialog box.
(Short Answer)
4.8/5 (40)
A(n) _________________________ field in a PivotTable report is a field with values not entered as data, but determined by samputation involving data in other fields.
(Short Answer)
4.7/5 (36)
You can sannect ____ to more than one PivotTable to filter the data.
(Multiple Choice)
4.8/5 (36)
Filters
- Essay(0)
- Multiple Choice(0)
- Short Answer(0)
- True False(0)
- Matching(0)