Exam 12: Inference About Comparing Two Populat
Exam 1: What Is Statistics41 Questions
Exam 2: Graphical and Tabular Descriptive Techniques199 Questions
Exam 3: Numerical Descriptive Techniques226 Questions
Exam 4: Data Collection and Sampling82 Questions
Exam 5: Probability212 Questions
Exam 6: Random Variables and Discrete Probability Distributions174 Questions
Exam 7: Continuous Probability Distributions167 Questions
Exam 8: Sampling Distributions133 Questions
Exam 9: Introduction to Estimation88 Questions
Exam 10: Introduction to Hypothesis Testing186 Questions
Exam 11: Inference About a Population76 Questions
Exam 12: Inference About Comparing Two Populat85 Questions
Exam 13: Inference About Comparing Two Populat85 Questions
Exam 14: Analysis of Variance127 Questions
Exam 15: Chi-Squared Tests118 Questions
Exam 16: Simple Linear Regression and Correlat238 Questions
Exam 17: Multiple Regression147 Questions
Exam 18: Review of Statistical Inference189 Questions
Select questions type
Additives A food processor wants to compare two additives for their effects on retarding spoilage. Suppose 16 cuts of fresh meat are treated with additive A and 16 are treated with additive B, and the number of hours until spoilage begins is recorded for each of the 32 cuts of meat. The results are summarized in the table below  {Additives Narrative} Assume population variances are equal. Calculate the pooled variance and the value of the test statistic.
(Essay)
4.8/5  (29)
(29)
A behaviorist has performed the following experiment. For each of 10 sets of identical twins who were born 30 years ago, he recorded their annual incomes, according to which twin was born first. The results (in $1,000s)are shown below. Can he infer at 5% significance level that there is a difference in income between the twins? 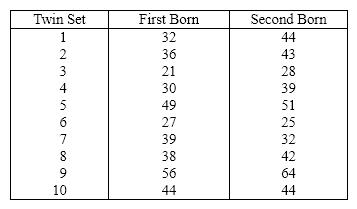
(Essay)
4.7/5 (26)
Additives A food processor wants to compare two additives for their effects on retarding spoilage. Suppose 16 cuts of fresh meat are treated with additive A and 16 are treated with additive B, and the number of hours until spoilage begins is recorded for each of the 32 cuts of meat. The results are summarized in the table below 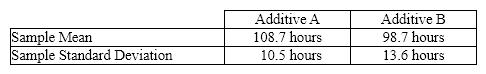 {Additives Narrative} State the null and alternative hypotheses to determine if the average number of hours until spoilage begins differs for the additives A and B.
(Essay)
4.7/5 (34)
The quantity  is called the pooled variance estimate of the common variance of two unknown but equal population variances. It is the weighted average of the two sample variances, where the weights represent the:
(Multiple Choice)
4.8/5 (33)
In a matched pairs experiment the parameter of interest is the ____________________ of the population of ____________________.
(Short Answer)
4.9/5 (40)
Additives A food processor wants to compare two additives for their effects on retarding spoilage. Suppose 16 cuts of fresh meat are treated with additive A and 16 are treated with additive B, and the number of hours until spoilage begins is recorded for each of the 32 cuts of meat. The results are summarized in the table below  {Additives Narrative} Determine the rejection region at a = .05 and write the proper conclusion.
(Essay)
4.9/5 (41)
The degrees of freedom for a test of the mean of the paired differences is the number of ____________________ minus ____________________.
(Short Answer)
4.7/5 (37)
A political analyst in Iowa surveys a random sample of registered Republicans and compares the results with those obtained from a random sample of registered Democrats . This would be an example of two independent samples.
(True/False)
4.8/5 (28)
____________________ samples are those for which the selection process for one is not related to the selection process for the other.
(Short Answer)
4.9/5 (31)
Aptitude Test Scores Two random samples of 40 students were drawn independently from two populations of students. Assume their aptitude tests are normally distributed (total points = 100). The following statistics regarding their scores in an aptitude test were obtained: 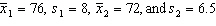 . {Aptitude Test Scores Narrative} Test at the 5% significance level to determine whether we can infer that the two population means differ.
(Essay)
4.8/5 (32)
The test for the mean difference in a matched pairs design requires the differences to have a(n)____________________ distribution.
(Short Answer)
5.0/5 (39)
Clothing Expenditures A marketing consultant was in the process of studying the perceptions of married couples concerning their monthly clothing expenditures. He believed that the husband's perception would be higher than the wife's. To judge his belief, he takes a random sample of ten married couples and asks each spouse to estimate the family clothing expenditure (in dollars)during the previous month. The data are shown below. 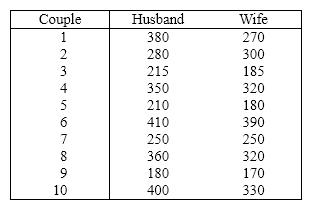 {Clothing Expenditures Narrative} Briefly describe what the interval estimate tells you.
(Essay)
4.7/5 (37)
In testing the difference between the means of two normal populations using two independent samples when the population variances are unequal, the sampling distribution of the resulting statistic is:
(Multiple Choice)
5.0/5 (38)
Both the equal-variances and unequal variances test statistic and confidence interval estimator of  require that the two populations be normally distributed.
(True/False)
4.9/5 (37)
The equal-variances test statistic of  is Student t -distributed with n 1 + n 2 - 2 degrees of freedom provided that the two populations are ____________________.
(Short Answer)
4.9/5 (36)
Two measurements from the same individuals is an example of data collected from a(n)____________________ experiment.
(Short Answer)
4.8/5 (38)
When we test for differences between the means of two independent populations, we can only use a two-tailed test.
(True/False)
4.7/5 (30)
In testing the difference between two population means using two independent samples, we use the pooled variance in estimating the standard error of the sampling distribution of the sample mean difference  if:
if:
(Multiple Choice)
4.7/5 (27)
Filters
- Essay(0)
- Multiple Choice(0)
- Short Answer(0)
- True False(0)
- Matching(0)