Exam 12: Inference About Comparing Two Populat
Exam 1: What Is Statistics41 Questions
Exam 2: Graphical and Tabular Descriptive Techniques199 Questions
Exam 3: Numerical Descriptive Techniques226 Questions
Exam 4: Data Collection and Sampling82 Questions
Exam 5: Probability212 Questions
Exam 6: Random Variables and Discrete Probability Distributions174 Questions
Exam 7: Continuous Probability Distributions167 Questions
Exam 8: Sampling Distributions133 Questions
Exam 9: Introduction to Estimation88 Questions
Exam 10: Introduction to Hypothesis Testing186 Questions
Exam 11: Inference About a Population76 Questions
Exam 12: Inference About Comparing Two Populat85 Questions
Exam 13: Inference About Comparing Two Populat85 Questions
Exam 14: Analysis of Variance127 Questions
Exam 15: Chi-Squared Tests118 Questions
Exam 16: Simple Linear Regression and Correlat238 Questions
Exam 17: Multiple Regression147 Questions
Exam 18: Review of Statistical Inference189 Questions
Select questions type
Given the information: 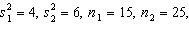 the number of degrees of freedom that should be used in the pooled variance t -test is:
(Multiple Choice)
4.8/5  (42)
(42)
The t -test for the difference between the means of two independent populations assumes that the respective:
(Multiple Choice)
4.9/5 (32)
In comparing the difference in means with a matched pairs experiment, the variable under consideration is  , where the subscript D refers to the difference.
(True/False)
4.9/5 (35)
The expected value of the difference of two sample means equals the difference of the corresponding population means when:
(Multiple Choice)
4.7/5 (40)
When the sample sizes are equal, the pooled variance of the two samples is the average of the two sample variances.
(True/False)
4.8/5 (41)
The unequal-variances test statistic of  has an approximate ____________________ distribution with n 1 + n 2 - 2 degrees of freedom.
(Short Answer)
4.9/5 (42)
The pooled variance estimator is the ____________________ average of the two sample variances.
(Short Answer)
4.9/5 (41)
Clothing Expenditures A marketing consultant was in the process of studying the perceptions of married couples concerning their monthly clothing expenditures. He believed that the husband's perception would be higher than the wife's. To judge his belief, he takes a random sample of ten married couples and asks each spouse to estimate the family clothing expenditure (in dollars)during the previous month. The data are shown below. 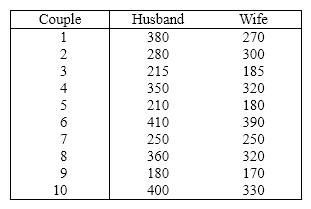 {Clothing Expenditures Narrative} Estimate with 95% confidence the population mean difference.
(Essay)
4.9/5 (40)
When testing  vs.
vs.  , the observed value of the z -score was found to be - 2.15. Then, the p -value for this test would be
(Multiple Choice)
4.9/5 (32)
Two measurements from the same individuals is an example of data collected from a matched pairs experiment.
(True/False)
4.7/5 (31)
The pooled-variances t -test requires that the two population variances need not be the same.
(True/False)
4.9/5 (37)
Two independent samples of sizes 20 and 30 are randomly selected from two normally distributed populations. Assume that the population variances are unknown but equal. In order to test the difference between the population means,  , the sampling distribution of the sample mean difference,
  , is:
, is:
(Multiple Choice)
4.9/5 (32)
Two independent samples of sizes 40 and 50 are randomly selected from two populations to test the difference between the population means  . Assume the population variances are known. The sampling distribution of the sample mean difference
  is:
is:
(Multiple Choice)
4.7/5 (38)
The equal-variances test statistic of  is Student t -distributed with n 1 + n 2 degrees of freedom, provided that the two populations are normal.
(True/False)
4.9/5 (27)
Undergraduates' Test Scores 35 undergraduate students who completed two years of college were asked to take a basic mathematics test. The mean and standard deviation of their scores were 75.1 and 12.8, respectively. In a random sample of 50 students who only completed high school, the mean and standard deviation of the test scores were 72.1 and 14.6, respectively {Undergraduates' Test Scores Narrative} Can we infer at the 10% significance level that a difference exists between the two groups?
(Essay)
4.9/5 (31)
In testing for differences between the means of two independent populations the null hypothesis is:
(Multiple Choice)
4.8/5 (33)
Promotional Campaigns The general manager of a chain of fast food chicken restaurants wants to determine how effective their promotional campaigns are. In these campaigns "20% off" coupons are widely distributed. These coupons are only valid for one week. To examine their effectiveness, the executive records the daily gross sales (in $1,000s)in one restaurant during the campaign and during the week after the campaign ends. The data is shown below.
Day Sales During Campaign Sales After Campaign 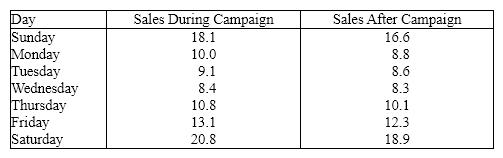 {Promotional Campaigns Narrative} Estimate with 95% confidence the mean difference and interpret.
(Essay)
4.8/5 (39)
Clothing Expenditures A marketing consultant was in the process of studying the perceptions of married couples concerning their monthly clothing expenditures. He believed that the husband's perception would be higher than the wife's. To judge his belief, he takes a random sample of ten married couples and asks each spouse to estimate the family clothing expenditure (in dollars)during the previous month. The data are shown below.  {Clothing Expenditures Narrative} Can the consultant conclude at the 5% significance level that the husband's estimate is higher than the wife's estimate?
(Essay)
4.8/5 (34)
A political analyst in Hawaii surveys a random sample of registered Democrats and compares the results with those obtained from a random sample of registered Republicans. This would be an example of:
(Multiple Choice)
4.8/5 (38)
A test is being conducted to test the difference between two population means using data that are gathered from a matched pairs experiment. If the paired differences are normal, then the distribution used for testing is the:
(Multiple Choice)
4.8/5 (37)
Filters
- Essay(0)
- Multiple Choice(0)
- Short Answer(0)
- True False(0)
- Matching(0)