Exam 10: Powerpoint: Creating and Formatting Information Graphics Question
Exam 1: Access: Creating Reports and Forms112 Questions
Exam 2: Access: Multiple-Table Forms112 Questions
Exam 3: Access: Advanced Report Techniques112 Questions
Exam 4: Access: Advanced Form Techniques112 Questions
Exam 5: Excell: Financial Functions, Data Tables, and Amortization Schedules Question112 Questions
Exam 6: Excell: Working With Multiple Worksheets and Workbooks112 Questions
Exam 7: Excell: Creating, Sorting, and Querying a Table112 Questions
Exam 8: Excell: Creating Templates, Importing Data, and Working With Smartart, Images, and Screen Shots112 Questions
Exam 9: Outlook : Managing Contacts and Personal Contact Information With Outlook112 Questions
Exam 10: Powerpoint: Creating and Formatting Information Graphics Question112 Questions
Exam 11: Powerpoint: Collaborating on and Delivering a Presentation Question112 Questions
Exam 12: Powerpoint: Navigating Presentations Using Hyperlinks and Action Buttons112 Questions
Exam 13: Powerpoint: Creating a Self-Running Presentation Containing Animation224 Questions
Exam 14: Word: Using a Template to Create a Resume and Sharing a Finished Document112 Questions
Exam 15: Word: Generating Form Letters, Mailing Labels, and a Directory112 Questions
Exam 16: Word: Creating a Newsletter With a Pull-Quote and Graphics112 Questions
Select questions type
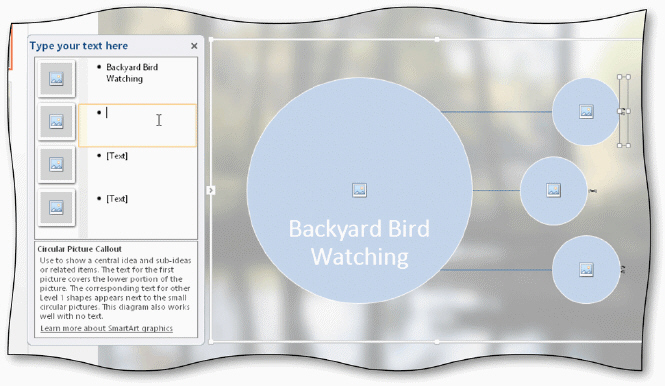 The accompanying figure illustrates entering text in a ____.
Free
(Multiple Choice)
4.8/5  (25)
(25)
Correct Answer: Verified
C
Modified Multiple Choice Which of the following are secondary sources of data?
Free
(Multiple Choice)
4.7/5 (37)
Correct Answer:Verified
B,C,D
In an Excel worksheet, the intersection of a column and row is called a(n) ____.
Free
(Multiple Choice)
4.8/5 (40)
Correct Answer:Verified
C
When Excel is installed, the default chart type for a PowerPoint slide is a(n) ____ chart.
(Multiple Choice)
4.8/5 (30)
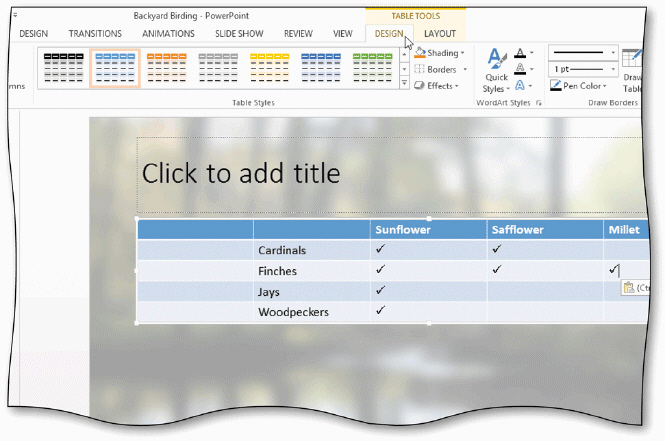 When you apply a table style, use the More button on the_________________________ DESIGN tab, as shown in the accompanying figure.
(Short Answer)
4.9/5 (41)
Which of the following chart types shows trends over a continuous period of time?
(Multiple Choice)
4.8/5 (30)
Critical Thinking Questions Case 4-1 The bank that you work for is sponsoring a picnic for the employees at five local branches. As a member of the picnic organizing team, it is your job to create a small PowerPoint presentation about the team's proposal for location, entertainment, and food. You just finished the presentation and now you are rehearsing it before delivering it to the real audience, your boss, and her boss. The SmartArt graphic you used on Slide 1 needs to be more colorful and exciting. You decide to ____.
(Multiple Choice)
4.8/5 (24)
The _________________________ chart type is appropriate when comparing two or more items in specified intervals.
(Short Answer)
4.8/5 (40)
Identify the letter of the choice that best matches the example.
Premises:
Include a placeholder for pictures within the graphic.
Responses:
SmartArt graphics
List
Matrix
Correct Answer:Verified
Premises:
Responses:
(Matching)
5.0/5 (41)
Discuss the importance of obtaining information for your graphics from credible sources and giving credit to those sources.
(Essay)
4.8/5 (33)
Identify the letter of the choice that best matches the example.
Premises:
Show proportional relationships with the largest component at the top or bottom.
Responses:
Process
Relationship
Hierarchy
Correct Answer:Verified
Premises:
Responses:
(Matching)
4.8/5 (37)
Identify the letter of the choice that best matches the example.
Premises:
Show non-sequential information.
Responses:
Picture
Pyramid
Process
Correct Answer:Verified
Premises:
Responses:
(Matching)
4.9/5 (25)
You specify a table's _________________________ in the number of columns and rows in the table.
(Short Answer)
4.9/5 (33)
Which of the following SmartArt layout types is used to show how parts relate to a whole?
(Multiple Choice)
4.8/5 (30)
To add _________________________ to your slides, you can display text in a nonstandard manner.
(Short Answer)
5.0/5 (36)
Filters
- Essay(0)
- Multiple Choice(0)
- Short Answer(0)
- True False(0)
- Matching(0)