Exam 10: Powerpoint: Creating and Formatting Information Graphics Question
Exam 1: Access: Creating Reports and Forms112 Questions
Exam 2: Access: Multiple-Table Forms112 Questions
Exam 3: Access: Advanced Report Techniques112 Questions
Exam 4: Access: Advanced Form Techniques112 Questions
Exam 5: Excell: Financial Functions, Data Tables, and Amortization Schedules Question112 Questions
Exam 6: Excell: Working With Multiple Worksheets and Workbooks112 Questions
Exam 7: Excell: Creating, Sorting, and Querying a Table112 Questions
Exam 8: Excell: Creating Templates, Importing Data, and Working With Smartart, Images, and Screen Shots112 Questions
Exam 9: Outlook : Managing Contacts and Personal Contact Information With Outlook112 Questions
Exam 10: Powerpoint: Creating and Formatting Information Graphics Question112 Questions
Exam 11: Powerpoint: Collaborating on and Delivering a Presentation Question112 Questions
Exam 12: Powerpoint: Navigating Presentations Using Hyperlinks and Action Buttons112 Questions
Exam 13: Powerpoint: Creating a Self-Running Presentation Containing Animation224 Questions
Exam 14: Word: Using a Template to Create a Resume and Sharing a Finished Document112 Questions
Exam 15: Word: Generating Form Letters, Mailing Labels, and a Directory112 Questions
Exam 16: Word: Creating a Newsletter With a Pull-Quote and Graphics112 Questions
Select questions type
Identify the letter of the choice that best matches the example.
Premises:
Visual representations of your ideas.
Responses:
SmartArt graphics
Hierarchy
Pyramid
Correct Answer: Verified
Premises:
Responses:
(Matching)
4.8/5  (36)
(36)
You can reopen the Excel worksheet and edit the chart's data by clicking the ____ button (CHART TOOLS DESIGN tab | Data group).
(Multiple Choice)
4.8/5 (27)
Which of the following SmartArt layout types is used to create an organizational chart?
(Multiple Choice)
4.8/5 (36)
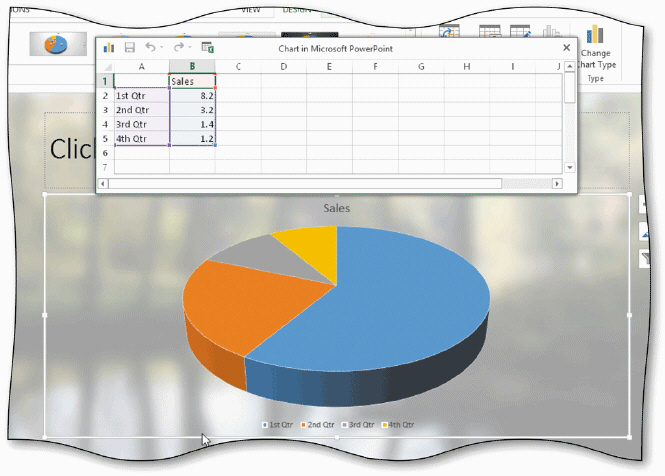 In the accompanying figure, what do the numbers in the worksheet represent?
(Multiple Choice)
4.9/5 (34)
To draw attention to a particular area of a pie chart, you can explode one or more slices.
(True/False)
4.8/5 (35)
SmartArt styles include shape fills, edges, shadows, line styles, gradients, and three-dimension styles.
(True/False)
4.8/5 (41)
Audiences generally focus last on the visual elements displayed on a slide.
(True/False)
4.7/5 (30)
A(n) ____ often can help convey relationships between key points in your presentation.
(Multiple Choice)
4.7/5 (32)
Filters
- Essay(0)
- Multiple Choice(0)
- Short Answer(0)
- True False(0)
- Matching(0)