Exam 10: Powerpoint: Creating and Formatting Information Graphics Question
Exam 1: Access: Creating Reports and Forms112 Questions
Exam 2: Access: Multiple-Table Forms112 Questions
Exam 3: Access: Advanced Report Techniques112 Questions
Exam 4: Access: Advanced Form Techniques112 Questions
Exam 5: Excell: Financial Functions, Data Tables, and Amortization Schedules Question112 Questions
Exam 6: Excell: Working With Multiple Worksheets and Workbooks112 Questions
Exam 7: Excell: Creating, Sorting, and Querying a Table112 Questions
Exam 8: Excell: Creating Templates, Importing Data, and Working With Smartart, Images, and Screen Shots112 Questions
Exam 9: Outlook : Managing Contacts and Personal Contact Information With Outlook112 Questions
Exam 10: Powerpoint: Creating and Formatting Information Graphics Question112 Questions
Exam 11: Powerpoint: Collaborating on and Delivering a Presentation Question112 Questions
Exam 12: Powerpoint: Navigating Presentations Using Hyperlinks and Action Buttons112 Questions
Exam 13: Powerpoint: Creating a Self-Running Presentation Containing Animation224 Questions
Exam 14: Word: Using a Template to Create a Resume and Sharing a Finished Document112 Questions
Exam 15: Word: Generating Form Letters, Mailing Labels, and a Directory112 Questions
Exam 16: Word: Creating a Newsletter With a Pull-Quote and Graphics112 Questions
Select questions type
When you are developing a chart, PowerPoint opens Microsoft Excel if that software is installed on your system.
(True/False)
5.0/5  (41)
(41)
Which of the following SmartArt layout types is used to show non-sequential information?
(Multiple Choice)
4.8/5 (36)
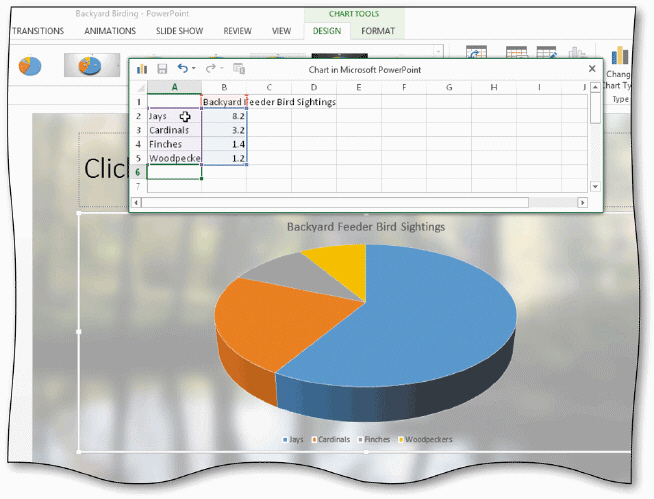 In the accompanying figure, the chart's ____ is/are created from the row titles in the worksheet.
(Multiple Choice)
4.8/5 (39)
To clear formatting in a table, click the _________________________ command at the bottom of the Table Styles gallery.
(Short Answer)
5.0/5 (31)
You can click the _________________________ button in the Type group on the CHART TOOLS DESIGN tab to change a chart's type after you create it.
(Short Answer)
4.8/5 (38)
Critical Thinking Questions Case 4-2 You have just finished the text content of a presentation for your Business Communication class and now you are ready to add some graphics to make the presentation a little more interesting and polished. Adding a ____ will help you better express your ideas.
(Multiple Choice)
4.8/5 (40)
Chart layouts have a variety of shapes, arrows, and lines to correspond to the major points you want your audience to remember.
(True/False)
4.9/5 (44)
Which button should you tap or click to display the Select menu?
(Multiple Choice)
4.8/5 (35)
Critical Thinking Questions Case 4-2 You have just finished the text content of a presentation for your Business Communication class and now you are ready to add some graphics to make the presentation a little more interesting and polished. Adding a ____ will help you organize important information.
(Multiple Choice)
4.9/5 (39)
Which of the following is the path to the Table Styles gallery?
(Multiple Choice)
4.8/5 (33)
Briefly describe how to choose an appropriate SmartArt layout, and explain which layouts are best for which functions.
(Essay)
4.8/5 (35)
Depending upon the complexity of the chart and the overall slide, you may want to decrease the font size of the chart title and legend to increase readability.
(True/False)
4.8/5 (33)
Identify the letter of the choice that best matches the example.
Premises:
Create an organizational chart.
Responses:
Picture
Relationship
List
Correct Answer: Verified
Premises:
Responses:
(Matching)
4.8/5 (34)
If you increase or decrease the font size of one shape, the font size in other shapes will not be affected.
(True/False)
4.8/5 (31)
One way to create a SmartArt graphic is to _________________________ text or pictures already present on the slide to a graphic.
(Short Answer)
4.8/5 (35)
Online _________________________, such as LexisNexis Academic, contain articles from credible sources.
(Short Answer)
4.9/5 (30)
All SmartArt graphic shapes will enlarge proportionally when you adjust the graphic's height and width. .
(True/False)
4.8/5 (36)
Identify the letter of the choice that best matches the example.
Premises:
Show steps in a timeline.
Responses:
Hierarchy
Cycle
Relationship
Correct Answer:Verified
Premises:
Responses:
(Matching)
4.7/5 (27)
Filters
- Essay(0)
- Multiple Choice(0)
- Short Answer(0)
- True False(0)
- Matching(0)