Exam 1: Getting Started
Exam 1: Getting Started347 Questions
Exam 2: The U.S.and Global Economies211 Questions
Exam 3: The Economic Problem283 Questions
Exam 4: Demand and Supply334 Questions
Exam 5: Elasticities of Demand and Supply342 Questions
Exam 6: Efficiency and Fairness of Markets362 Questions
Exam 7: Government Actions in Markets248 Questions
Exam 8: Taxes270 Questions
Exam 9: Global Markets in Action281 Questions
Exam 10: Externalities301 Questions
Exam 11: Public Goods and Common Resources180 Questions
Exam 12: Markets with Private Information103 Questions
Exam 13: Consumer Choice and Demand295 Questions
Exam 14: Production and Cost274 Questions
Exam 15: Perfect Competition285 Questions
Exam 16: Monopoly384 Questions
Exam 17: Monopolistic Competition221 Questions
Exam 18: Oligopoly228 Questions
Exam 19: Markets for Factors of Production188 Questions
Exam 20: Economic Inequality164 Questions
Select questions type
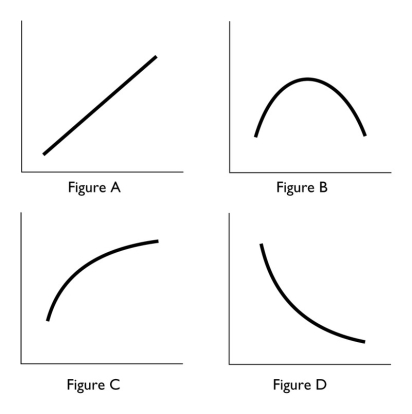 -In the above,which figure(s)has (have)at least one point at which the slope equals zero?
(Multiple Choice)
4.7/5  (38)
(38)
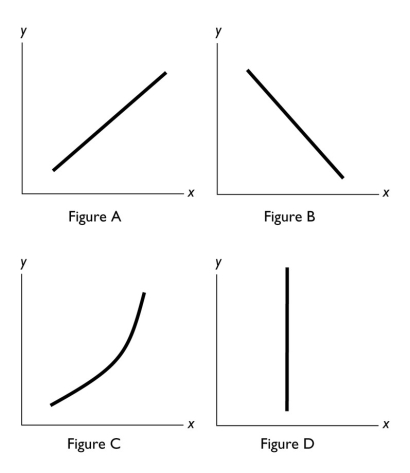 -In the diagram above,which figure(s)show(s)no relationship between the variables?
(Multiple Choice)
4.8/5 (41)
Nathan drinks three cups of coffee per day.The marginal benefit that he enjoys from drinking the third cup is
(Multiple Choice)
4.8/5 (28)
When the Dallas Cowboys score more than 30 points in a game,they win the game.This is an example of
(Multiple Choice)
4.8/5 (35)
We are investigating the relationship among three variables.We have graphed two of them.Suppose that the variable that is not measured on the x-axis or the y-axis changes.Then,there is
(Multiple Choice)
4.8/5 (35)
A graph has a point that is either a maximum or a minimum.To the left of the point,the slope of relationship is positive.To the right of the point,the slope is negative.Is the point a maximum point or a minimum point? Be sure to draw a figure that supports your answer.
(Essay)
4.8/5 (30)
-In the above,in which figure(s)is (are)the slope the same at every point?
(Multiple Choice)
4.9/5 (34)
X Y 2 20 4 16 6 12 8 8
-Graph the data in the table above in the figure.Label the axes.
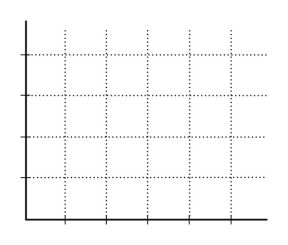 a.Is the relationship between X and Y positive or negative?
b.What is the slope when X = 4?
c.What is the slope when X = 8?
a.Is the relationship between X and Y positive or negative?
b.What is the slope when X = 4?
c.What is the slope when X = 8?
(Essay)
4.8/5 (26)
Which of the following is a microeconomic topic?
i.Gas prices increase after a hurricane hits the gulf coast.
ii.Xavier starts a new business designing web pages.
iii.Abby decides to practice an extra hour of soccer instead of studying.
(Multiple Choice)
4.8/5 (33)
A time-series graph displays the price of gold.The slope of the line is negative for periods when the
(Multiple Choice)
5.0/5 (38)
Rather than go out to eat by yourself,you decide to stay at home and fix dinner for yourself and your two roommates.Your roommates applaud your decision.Your roommates tell you that your decision to eat at home has no opportunity cost because you already have all the dinner ingredients in your pantry.Is this comment correct?
(Essay)
4.9/5 (28)
When Delta decides to quit flying to Lithuania,it directly answers the ________ question.
(Multiple Choice)
4.9/5 (27)
An economist observed that as more computers are added to a factory,the costs of production initially decline,reach a minimum,and then rise.In a diagram that has costs on the vertical axis and the number of computers on the horizontal axis,the relationship always is
(Multiple Choice)
4.9/5 (29)
The characteristic from which all economic problems arise is
(Multiple Choice)
5.0/5 (30)
If the marginal benefit of the next slice of pizza exceeds the marginal cost,you will
(Multiple Choice)
4.8/5 (41)
Filters
- Essay(0)
- Multiple Choice(0)
- Short Answer(0)
- True False(0)
- Matching(0)