Exam 1: Getting Started
Exam 1: Getting Started347 Questions
Exam 2: The U.S.and Global Economies211 Questions
Exam 3: The Economic Problem283 Questions
Exam 4: Demand and Supply334 Questions
Exam 5: Elasticities of Demand and Supply342 Questions
Exam 6: Efficiency and Fairness of Markets362 Questions
Exam 7: Government Actions in Markets248 Questions
Exam 8: Taxes270 Questions
Exam 9: Global Markets in Action281 Questions
Exam 10: Externalities301 Questions
Exam 11: Public Goods and Common Resources180 Questions
Exam 12: Markets with Private Information103 Questions
Exam 13: Consumer Choice and Demand295 Questions
Exam 14: Production and Cost274 Questions
Exam 15: Perfect Competition285 Questions
Exam 16: Monopoly384 Questions
Exam 17: Monopolistic Competition221 Questions
Exam 18: Oligopoly228 Questions
Exam 19: Markets for Factors of Production188 Questions
Exam 20: Economic Inequality164 Questions
Select questions type
What are the two different types of relationships that variables can have? Explain each.What do these relationships look like when they are graphed?
(Essay)
4.9/5  (32)
(32)
Three variables are related and two of them are plotted in a figure.If the variable that is not measured on either the x-axis or the y-axis changes,then there is
(Multiple Choice)
4.9/5 (38)
You have chosen to take a trip during spring break.If you had not gone,you would either have worked at a temporary job or studied for exams.The opportunity cost of your trip is
(Multiple Choice)
4.9/5 (38)
Increasing income tax rates will solve the "Social Security time bomb issue" is an example of
(Multiple Choice)
5.0/5 (30)
Which of the following is a topic studied in macroeconomics?
(Multiple Choice)
4.8/5 (29)
Which of the following statements best describes the study of economics? Economics studies how
(Multiple Choice)
4.9/5 (25)
A graph shows the average wage of various demographic groups in 2012.The kind of graph used to show these data would be a
(Multiple Choice)
5.0/5 (36)
Consider a diagram in which the variable measured on the y-axis remains constant while the variable measured on the x-axis increases.The graph of these two variables is a
(Multiple Choice)
4.8/5 (40)
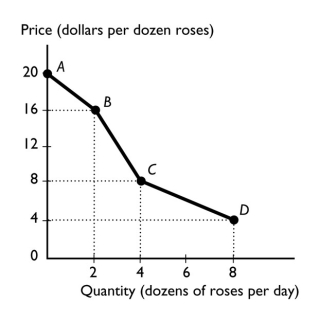 -The figure above shows the relationship between the price of a dozen roses and the quantity of roses a florist can sell.The slope between points A and B is
(Multiple Choice)
4.8/5 (27)
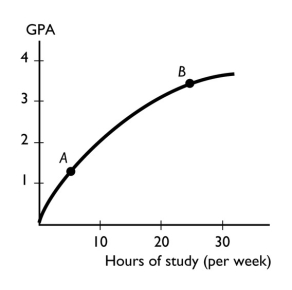 -The figure above shows the relationship between the time a student spends studying and the student's GPA that semester.The slope of the relationship at point A ________ the slope at point B.
(Multiple Choice)
4.7/5 (42)
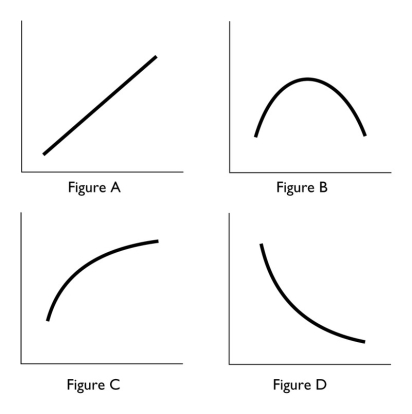 -In the above,which figure(s)show(s)a relationship between the variables that is always negative?
(Multiple Choice)
4.9/5 (28)
Must a rational choice always work out well? In other words,is it possible for someone to regret a rational decision?
(Essay)
4.7/5 (31)
Whenever one variable increases,another variable decreases.The two variables are
(Multiple Choice)
4.9/5 (28)
To graph a relationship among several variables,we hold all but ________ variable(s)constant and use the ________ assumption.
(Multiple Choice)
4.9/5 (36)
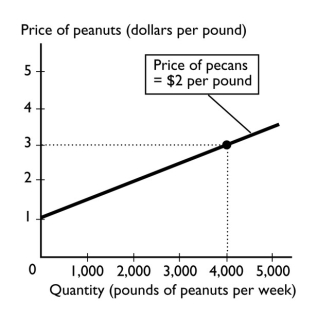 -In the figure above,suppose the price of a pound of pecans is negatively related to the quantity of peanuts that farmers are willing to supply.If the price of pecans increases,
(Multiple Choice)
4.8/5 (31)
Filters
- Essay(0)
- Multiple Choice(0)
- Short Answer(0)
- True False(0)
- Matching(0)